Introduction
Most data teams have lived through this headache. A vendor shows off shiny charts, slick buttons, and fast dashboards during an afternoon sales demo.
Your company buys the tool. Then, reality hits hard.
The software cannot connect to your automated test pipelines. Every time an engineer updates a table schema, four critical executive dashboards break without warning. Your best data engineers end up spending hours each week fixing broken reports by hand.
Picking the right analytics software can make or break your team speed. The tools you choose either fit smoothly into your automated workflows or slow everyone down.
At TheDataOps.org, we share practical ways to build fast, dependable data operations without the usual stress.
In this guide, you will learn what makes an analytics platform modern, the six core pillars to look for, and how to test any tool safely before you sign a contract.
Simple Definition & Basics
A DataOps-ready analytics platform is a reporting tool built to handle daily code changes, automated tests, and fast team collaboration without manual fixes.
Legacy BI tools struggle today because they rely on closed, click-only setups. When you build reports only by pointing and clicking, you cannot track who changed a metric. You cannot run automated tests before dashboards go live. As a result, bad data slips through to your business users, trust drops, and your engineers get stuck doing damage control.
6 Core Pillars to Look For in a Platform
When you evaluate any tool, keep these six must-have features top of mind:
1. Version Control Support
- Code-backed metrics: The tool stores dashboards, metrics, and models as plain text files or code.
- Easy rollback: If an update breaks a chart, you can undo the change with a single click.
- Clear change logs: You always know who updated a calculation, when they did it, and why.
2. Open API Connectors
- Broad pipeline hooks: The platform connects smoothly to your storage layers, warehouses, and transformation tools.
- Scripted deployments: You can push new dashboard versions using simple automated scripts.
- No data traps: You can extract your metadata and numbers anytime without extra fees.
3. Automated Testing Hooks
- Pre-run checks: The system tests calculations before reports update for business users.
- Schema alerts: If a column name changes upstream, the platform flags the issue right away.
- Silent failure prevention: Bad numbers get caught in staging before leaders make big decisions.
4. Granular Role Access
- Role-based permissions: Set viewing and editing rules by user group, team, or department.
- Row-level safety: Sales reps see only their regional numbers, while leaders see the whole company.
- Audit trails: Easy logs show who viewed or changed sensitive company figures.
5. Transparent Query Costs
- Cost tracking: See which reports consume the most warehouse compute power.
- Query caching: Store common query answers so you do not run costly computations twice.
- Usage guardrails: Set spending limits so no rogue dashboard runs up huge bills overnight.
6. Real-Time Alerting
- Instant notifications: Get alerts in your team chat tool when a pipeline fails.
- Metric anomaly warnings: The tool warns you if weekly sales numbers drop to zero unexpectedly.
- Fast incident response: Spot and fix broken views before stakeholders even notice them.
Selecting Analytics Platforms for DataOps Success
Selecting Analytics Platforms for DataOps Success means looking past slick demo slides. You must test how a tool behaves during the daily grind of schema changes, code commits, and team handoffs.
Think of it like buying a car. A shiny car looks great on the showroom floor. But if the hood is welded shut, you cannot change the oil, check the engine, or swap a spark plug.
Closed analytics platforms are just like that welded car. When something breaks deep inside, your engineers cannot fix it with standard scripts. They must click through dozens of confusing menu screens to find the error.
Assessing Team Skill Levels and Eliminating Tool Silos
Start with the people who will touch the platform every single day.
If your analysts know SQL and your business partners prefer drag-and-drop charts, your platform must support both styles cleanly. Avoid tools that force everyone into rigid silos. When business users work in one tool and engineers work in another, definitions drift apart. Soon, finance and marketing show two completely different revenue numbers for the same month.
Testing Daily Code Commits and Schema Updates
A strong tool welcomes frequent updates.
Test how the platform reacts when your data engineering team changes a column from text to numbers. Does the tool crash silently, or does it run an automated check and notify your team? A DataOps-friendly tool handles daily updates gracefully through automated testing hooks and clean branch testing.
Avoiding Hidden Cost Traps as Data Grows
Watch out for sneaky pricing models.
Some vendors charge low entry prices but charge steep fees when your team grows or data volume jumps. Other platforms fire unoptimized queries that hammer your data warehouse, causing your monthly compute bills to surge. Look for platforms that cache common answers, optimize queries, and offer clear, predictable licensing.
Balancing Business Ease with Engineer Control
You do not have to pick between simple drag-and-drop tools and code-heavy engines.
The best platforms offer a visual canvas on top of a clean code base. Non-technical team members get the intuitive dashboards they want. Meanwhile, analytics engineers keep full control over data modeling, versioning, and pipeline tests behind the scenes.
TheDataOps.org Guide to Tool Evaluation
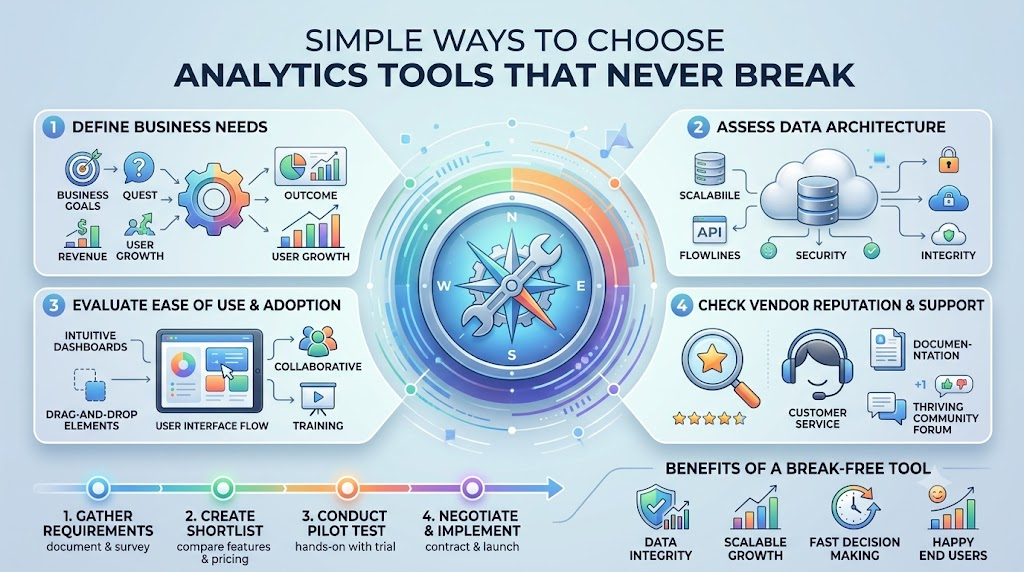
At TheDataOps.org, we recommend testing tools inside your actual work environment before spending budget. A safe two-week proof of concept helps you see how the platform performs under real pressure.
Follow this simple evaluation framework:
Week 1: Build and Break
Connect the platform to a small copy of your real data warehouse.
Have an analytics engineer build a simple metric model, commit it to your code repository, and trigger an automated deployment. Then, change an upstream column name on purpose. See if the platform flags the break immediately or if it shows broken charts without warning.
Week 2: Hand the Keys to End Users
Invite two business analysts and one executive to test the platform.
Ask them to build a standard sales report and answer a basic business question without engineer help. Time how long it takes them to complete the task. Check if they find the interface simple or if they hit confusing roadblocks.
Score the Results Honestly
Grade the platform against four simple pass/fail questions:
- Did the platform connect cleanly with our existing data pipeline?
- Did automated tests catch intentional breaks?
- Could non-technical team members build basic charts easily?
- Are query compute costs clear, predictable, and manageable?
If a vendor fails two or more of these checks, move on. No amount of shiny demo features can make up for poor pipeline integration.
Real-World Applications
Choosing the right platform changes how different teams deliver results every day:
- Self-Service Sales Dashboards: Sales leaders build weekly performance views on their own. Meanwhile, analytics engineers govern the underlying calculations so nobody reports false revenue figures.
- Real-Time Fraud Alerts: Operations teams monitor transaction streams. If unusual purchase spikes occur, the platform flags the event in team chat within seconds.
- Automated Customer Cohort Tracking: Marketing teams track user retention across product launches. When marketing adds new tracking tags, automated tests keep reporting steady.
- Supply Chain Monitoring: Logistics teams track warehouse inventory across regions. The platform pulls fresh data hourly without slowing down the primary production database.
Comparison Table
| Feature or Capability | DataOps-Ready Analytics Platforms | Legacy Closed BI Systems |
| Code Control | Stores metrics and models as plain text files in version control. | Traps calculations inside closed binary files or complex menus. |
| Pipeline Automation | Deploys dashboard updates using automated scripts and tests. | Requires manual uploads, clicks, and manual verification steps. |
| Integration Ease | Connects smoothly to modern data warehouses via open APIs. | Requires rigid custom drivers and proprietary connector tools. |
| Cost Scaling | Transparent usage models with query caching to lower costs. | Hidden costs that jump sharply as users and queries expand. |
| Team Speed | Fast release cycles with few breaks and fast fixes. | Slow delivery with high risk of broken charts on release day. |
Why Smart Platform Selection Matters
When you pick the right platform, your engineers stop spending half their week fixing broken charts. They can focus on building new data features, improving data quality, and helping the business move faster.
Business leaders get numbers they can trust without waiting days for an analyst to double-check every cell. Decisions happen faster, projects launch on schedule, and cross-team trust stays high.
Common Buying Traps & How to Avoid Them
Buying software is tricky. Avoid these three frequent mistakes:
- Falling for Vanity Demo Features: Vendors love to show off 3D maps and complex charts. In real life, simple bar charts and line graphs answer 95% of business questions. Focus on core speed, testing, and connection ease instead.
- Ignoring Vendor Lock-In: Some platforms make it nearly impossible to export your data models. If you ever leave, you have to rebuild everything from scratch. Choose platforms that let you export your logic as plain code.
- Failing to Test Real Data Volumes: A demo runs on clean, tiny datasets. Run your evaluation on messy, high-volume tables to see if queries slow down or fail under load.
5 Easy Steps to Run a Platform Selection Test
Follow this quick checklist to test any analytics vendor:
- Map your current tools: List your databases, pipelines, and the tools your teams use daily.
- Set firm must-have rules: Decide which features are non-negotiable, such as code control and open APIs.
- Run a short test with real data: Connect the trial software to your actual data stack for two weeks.
- Try to break the system: Change table names and push updates to see how automated alerts perform.
- Get honest user feedback: Ask your business analysts if they enjoy using the interface before you sign.
Relevant Career Roles
These five core roles play a key part in choosing and running your platforms:
- Analytics Platform Architect: Designs the complete data stack and ensures all tools fit together smoothly.
- DataOps Lead: Builds automated testing pipelines and keeps data delivery cycles fast and safe.
- BI Developer: Builds intuitive dashboards, reports, and clear visual views for business stakeholders.
- Enterprise Data Buyer: Manages software budgets, negotiates vendor contracts, and checks license terms.
- Data Governance Specialist: Sets data privacy rules, manages user access, and monitors company data compliance.
Future Trends in Analytics Platforms
Watch for these simple shifts in the data landscape:
- Natural Language Queries: Business users will ask plain-English questions to generate accurate, governed charts on the fly.
- Code-First Metric Layers: More platforms will store business definitions in central code files shared across all tools.
- Automatic Cost Guardrails: Platforms will automatically cancel runaway queries before they run up huge warehouse bills.
- Integrated Data Lineage: Tools will visually show users the exact data path from raw source to final report.
Common Myths Debunked
- Myth 1: The most expensive platform is always the best.
- Fact: High price tags often pay for legacy brand names, not modern automation features.
- Myth 2: One single platform can solve every data need.
- Fact: The best teams connect specialized, best-in-class tools rather than relying on one bloated suite.
- Myth 3: Business teams cannot use code-friendly tools.
- Fact: Modern platforms offer simple visual views on top, while keeping code control safe underneath.
- Myth 4: DataOps only matters for large tech giants.
- Fact: Small teams need automated pipelines even more because they have fewer engineers to fix broken reports.
Frequently Asked Questions (FAQ)
1. What is the main goal of Selecting Analytics Platforms for DataOps Success?
The main goal is finding tools that support automated testing, code control, and fast team collaboration. This helps your team deliver accurate reports quickly without manual fixes.
2. Can business users handle a platform that uses version control?
Yes, modern platforms hide the complex code from non-technical users. Business analysts use an intuitive visual interface, while the platform records changes as code in the background.
3. How long should a tool evaluation take?
A practical trial takes about two weeks. That gives your engineers enough time to test pipeline connections and lets business users test basic dashboard creation.
4. Why do traditional BI tools break during data updates?
Traditional tools often rely on manual, click-based configurations. When an engineer changes an upstream table, the tool has no automated way to test or flag the change, so the dashboard breaks.
5. How does code-backed reporting save time?
When reports live as code, engineers can track changes, copy templates, and fix errors fast. If a bad update goes live, the team can roll back to the prior version in seconds.
6. What is query caching and why does it matter?
Query caching saves the answers to common dashboard queries in memory. This stops the platform from querying your database repeatedly, which cuts cloud costs and speeds up dashboards.
7. Should we replace our whole data stack to use a modern analytics tool?
No, modern platforms connect smoothly with your existing data warehouses and storage layers. You can replace your reporting layer without touching your underlying data foundation.
8. How do open APIs help with daily data tasks?
Open APIs let your team write simple scripts to push dashboard updates, pull metadata, and trigger tests. This removes manual admin tasks and speeds up daily releases.
9. What is the biggest mistake teams make when buying an analytics tool?
The biggest mistake is buying based on slick sales demos without testing the tool on real company data. Always test how the tool handles your messy data and daily schema updates.
10. How does a modern analytics platform improve data trust?
Automated tests catch errors before reports reach company leaders. When dashboards show consistent, verified numbers day after day, trust in your data team grows quickly.
Finding the right analytics platform comes down to keeping daily work simple, safe, and fast for your team. When you pick tools that value code control, automated checks, and open connections, you set your engineers and business partners up for lasting success. Explore the guides and frameworks at TheDataOps.org to make your next software choice with total confidence.
