Introduction
Imagine a manager walks into a Monday meeting with a sales report. Another manager has a different report, and the numbers do not match. Both reports came from the same company data, yet nobody can say which one is right. The meeting turns into an argument about the data instead of a talk about the business.
This happens in companies of every size. Data comes from many places: apps, websites, sales tools, payment systems, and spreadsheets. It moves through many hands before it reaches a report. Along the way, things break. A column gets renamed, a file arrives late, or a number gets copied wrong. By the time leaders see the final report, they are not sure they can trust it.
DataOps is a way of fixing this. It brings simple habits like testing, automation, and teamwork into how data is handled, so data reaches people fast and stays correct. If you want a clear place to learn these ideas, you can visit Thedataops.org. In this article, we will look at how DataOps works in real life, how to start, and what to avoid. I will explain it the way I would to a smart new team member on their first day.
Why The Old Way of Managing Data Fails
Let us begin with how most companies handle data today. Over the years, one team builds a script to pull data. Another team builds a spreadsheet to clean it. A third team builds a dashboard on top. Nobody planned the whole path. It just grew, piece by piece, and now it is a long chain where a break in one link damages everything after it.
The first problem is that errors are found too late. In the old way, nobody checks the data as it moves. A bad value enters at the start and travels quietly all the way to the final report. Often the first person to notice is a business leader who sees a strange number in a meeting. By then, the wrong data may have already been used to make decisions.
The second problem is speed. When an analyst needs new data, the request goes into a queue. A data engineer builds it by hand, tests it by hand, and then moves it to the live system by hand. This can take weeks. In that time, the business question may have changed. People get tired of waiting, so they make their own copies of data in spreadsheets, and this creates even more confusion about which numbers are correct.
The third problem is that everything depends on a few people. Often, one engineer knows how a certain data pipeline works, because they built it years ago and never wrote it down. When that person is on leave or leaves the company, nobody knows how to fix it when it breaks. The team becomes afraid to touch anything, and the whole system gets stuck.
The fourth problem is the fear of change. Because there are no automatic tests, every small change is risky. Teams do not know what else might break. So they avoid improving things, and the data system grows older and messier. This is how companies end up with slow reports, missing data, and leaders who no longer trust what they see.
Real-World DataOps Implementations: How It Actually Works
The best way to understand DataOps is to see it in action. Below are common situations where teams use it, explained in simple terms. The names of companies are left out, but the patterns are very common in real projects.
Retail: Trusting Daily Sales Numbers
A large retail company sells through stores and an online shop. Every night, sales data from hundreds of stores flows into one central place. In the old setup, if one store sent a broken file, the whole sales report was wrong the next morning, and nobody knew why until noon.
With DataOps, the team adds automatic checks at each step. Does every store file arrive? Are the sales amounts positive numbers? Is the total close to what we usually see on this day of the week? If a check fails, the system stops that file, alerts the team, and keeps the rest of the report safe. Leaders now get a report they can trust, and the team fixes the problem in minutes instead of hours.
Banking: Catching Data Problems Before Auditors Do
Banks have strict rules about data. They must show where each number came from and prove it was not changed by mistake. In the old way, teams answered these questions by digging through old emails and scripts, which took days.
With DataOps, every step of the data path is recorded automatically. The team can see where a number began, how it changed, and who approved the change. Tests run every time something new is added, so mistakes are caught early. When auditors ask questions, the answers are ready in minutes. This saves stress, time, and money, and it lowers the risk of costly errors.
Healthcare: Getting Clean Data to Decision Makers Faster
A hospital group collects data from patient systems, lab machines, and billing tools. These systems use different formats, so combining them is painful. Reports about bed use or waiting times used to take weeks to prepare.
With DataOps, the team builds automated pipelines that clean and match the data every day. They add rules to protect private patient details and check that important fields are never empty. Managers can now see up-to-date numbers on waiting times and plan staff shifts better. The team also spends less time fixing broken files and more time improving the reports.
E-commerce: Shipping New Data Features Quickly
An online shop wants to show personal product suggestions to customers. This needs fresh data about what people browse and buy. In the old way, each new data feature took weeks to build and test by hand.
With DataOps, the team uses a simple, repeatable process. A new change is written, tested automatically, reviewed by a teammate, and then moved live with one step. If something goes wrong, they can roll back to the last working version quickly. This lets the team release small improvements often, instead of one big risky release every few months.
Manufacturing: Using Machine Data Without the Mess
A factory collects data from machines about heat, speed, and output. The data is noisy, and some sensors send bad readings now and then. Without checks, these bad readings would mislead the reports and alarms.
With DataOps, the team adds simple rules that filter out impossible values and flag missing readings. They also monitor the pipeline itself, so if data stops flowing from one machine, they know right away. The result is cleaner data, fewer false alarms, and better trust from the people on the factory floor.
The Step-by-Step Guide to Getting Started
After many years of working with data teams, I can tell you one thing. The companies that succeed with DataOps do not try to change everything in one go. They start small, learn, and grow. Here is a path that works.
Step 1: Pick One Data Problem That Hurts
Do not begin with a huge plan. Choose one problem that people already complain about, such as a report that is often wrong or a pipeline that keeps breaking. A clear and painful problem gives you a strong reason to change and an easy way to show progress.
Step 2: Map How the Data Moves Today
Draw a simple picture of where the data starts, what happens to it, and where it ends up. Include every script, file, and person involved. Many teams are surprised by what they find. This map helps you see where errors can sneak in and where checks should go.
Step 3: Add Simple Automatic Checks
Start with easy tests. Is the file there? Are there empty values where there should be none? Are the numbers in a normal range? Even a handful of basic checks can catch a large share of common problems. You can add smarter checks later.
Step 4: Automate the Repeated Steps
Look for manual steps that people do again and again, such as copying files, running scripts, or moving data to the live system. Turn these into automatic jobs. This reduces mistakes and frees people to do more useful work.
Step 5: Keep Everything in Version Control
Store your data code, settings, and tests in a shared place that tracks every change, so you can see who changed what and go back if needed. This makes teamwork much safer and removes the fear of touching things.
Step 6: Watch the Pipeline Like a Hawk
Set up alerts so the team knows when data is late, missing, or strange. It is far better to hear about a problem from an alert at 6 AM than from an angry manager at 10 AM.
Step 7: Bring People Together
DataOps is not only about tools. Data engineers, analysts, and business users need to talk to each other often. Hold short regular check-ins. Agree on what “good data” means. When people share the goal, quality improves naturally.
Step 8: Measure and Grow
Track a few simple numbers, such as how long it takes to deliver new data, how often pipelines fail, and how fast problems get fixed. Show these numbers to your team and leaders. When they see progress, support for DataOps grows, and you can take on the next problem.
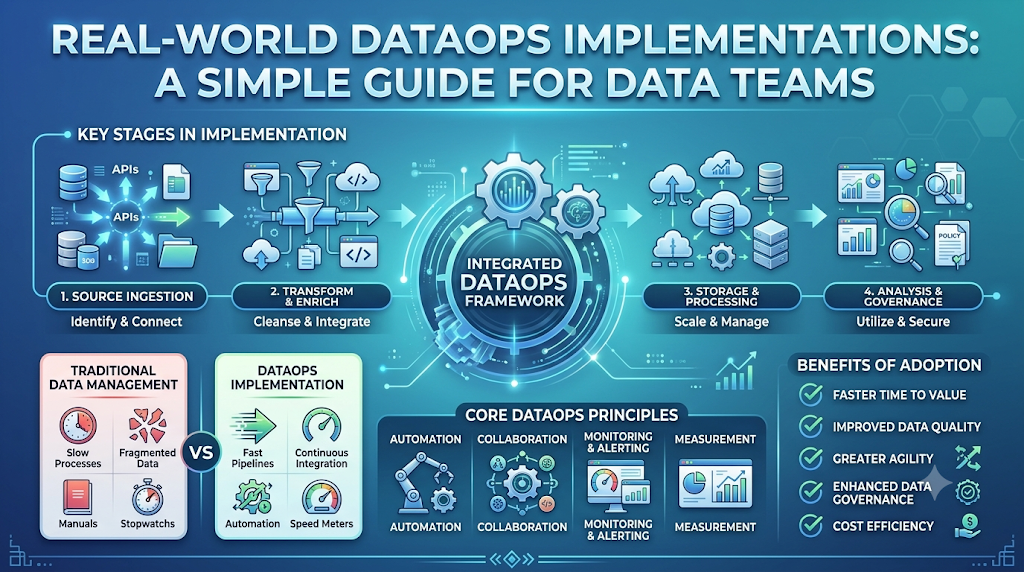
Comparing Traditional Data Teams vs. DataOps Teams
Here is a simple side-by-side view of how daily life changes.
| Area | Traditional Data Team | DataOps Team |
|---|---|---|
| Finding errors | Often after a leader spots a wrong number | Caught early by automatic checks |
| Delivering new data | Takes weeks, done by hand | Takes days or hours, done with automation |
| Testing | Manual, or skipped when in a hurry | Automatic and run every time |
| Fixing problems | Slow, with a lot of guessing | Fast, with alerts pointing to the cause |
| Knowledge | Stored in a few people’s heads | Written down in shared code and notes |
| Making changes | Risky and feared | Safe, with easy rollback |
| Teamwork | Teams work in separate corners | Engineers, analysts, and business work together |
| Trust in data | Low, with many arguments about numbers | High, with clear proof of quality |
| Team mood | Stressed and firefighting | Calmer, with time to improve things |
| Growth | Needs more people as data grows | Handles more data with the same team |
The pattern is clear. DataOps does not remove the need for skilled people. It gives them a safer and faster way to do their best work.
The Big Benefits for the Whole Company
The first big benefit is time. When checks, tests, and data movement run on their own, teams stop wasting hours on repeated work and firefighting. A data engineer who once spent half the week fixing broken pipelines can now spend that time building useful new things. Analysts also get data faster, so they can answer business questions while the questions still matter.
The second benefit is trust. When leaders know the data is checked at every step, they stop arguing about whose numbers are right and start talking about what to do next. This changes the mood of the whole company. Meetings become shorter and more useful. People feel more sure about their choices because they know the facts behind them are solid.
The third benefit is lower cost and lower risk. Bad data can lead to bad choices, like ordering too much stock, missing a sales chance, or breaking a rule. Fixing these problems later is much more expensive than preventing them early. DataOps also reduces the need for emergency work at odd hours, which saves money and keeps people from burning out.
The last benefit is the ability to grow. As a company gets more data and more users, the old manual way starts to crack. With DataOps, the same team can handle much more, because the routine work is automated and quality is built in. This gives the business a steady base to try new ideas, like better reports or smarter tools, without fear that the data underneath will fall apart.
FAQs
1. What is DataOps in simple words?
DataOps is a way of managing data using teamwork, automation, and regular testing so that data is delivered quickly and stays correct.
2. How is DataOps different from DevOps?
DevOps focuses on building and running software smoothly. DataOps uses similar ideas, but it focuses on data pipelines and data quality.
3. Why do companies need DataOps?
Companies have more data than ever, coming from many sources. Without DataOps, errors, delays, and confusion become common, and people stop trusting the numbers.
4. Is DataOps only for large companies?
No. Small and mid-sized teams can also use DataOps. They can start with a few simple checks on one pipeline and grow from there.
5. What are some real-world examples of DataOps?
Common examples include checking daily sales data in retail, tracking data history in banking, cleaning patient data in healthcare, and filtering bad sensor readings in manufacturing.
6. Do I need special tools to start DataOps?
Not at the beginning. You can start with simple checks, shared code storage, and basic alerts. Tools can be added later as your needs grow.
7. How long does it take to see results?
Many teams see early benefits, such as fewer broken reports, within a few weeks. Bigger gains build up over months as more steps get automated.
8. What are the most common mistakes in DataOps?
Trying to change everything at once, skipping tests, ignoring the people side, and not tracking results are the most common mistakes. Starting small avoids most of them.
9. Will DataOps replace data engineers?
No. It takes over repeated manual work so engineers can focus on design, improvement, and solving new problems.
10. How do I measure if DataOps is working?
Track simple numbers such as how long it takes to deliver new data, how often pipelines fail, how quickly problems are fixed, and how much people trust the reports.
Conclusion
DataOps is not a fancy tool or a magic fix. It is a practical way of working. You check your data early, automate the repeated steps, keep changes safe, and get your people talking to each other. When you do this, data becomes something the company can depend on, instead of something everyone worries about.
The real-world examples in retail, banking, healthcare, e-commerce, and manufacturing all show the same lesson. Teams that start small, fix one real problem, and measure the results see steady gains in speed and trust. The old way of handling data by hand works less and less as data keeps growing.
You do not need a huge budget or a big team to begin. Pick one painful problem, add a few simple checks, and build from there. The best time to start is before the next wrong report reaches the boardroom.
