Manufacturing plants generate more data than ever—historian tags, MES records, PLC signals, quality measurements—yet most of it never reaches a decision that improves the line. The gap is rarely a lack of data or even a lack of analytics tools. It is that the data lacks context, consistency, and a reliable path from the shop floor to the analyst. DataOps, adapted for industrial environments, addresses that gap directly.
This article examines how DataOps principles apply to manufacturing analytics optimization. It covers what Industrial DataOps actually means in practice, the specific problems it solves on the plant floor, a phased implementation sequence, and the failure modes that derail most manufacturing analytics initiatives before they deliver measurable value.
Why Manufacturing Analytics Stalls at the Data Layer
Most manufacturing organizations have already invested in connectivity. Historians collect time-series data, MES systems track production, PLCs generate high-frequency signals, and dashboards report on performance . The infrastructure exists. The problem is usability.
Raw industrial data is fragmented across systems, signals lack process context, multiple sources of truth erode trust, and analysis requires significant manual effort . A temperature reading of 187 on a compressor discharge means something entirely different from the same numerical value on a cooling water return—without contextualization, the number is meaningless to any downstream model .
The result is predictable. Dashboards show what happened, not why. Data platforms organize data without making it usable. AI initiatives start too big, without validated foundations . Organizations spend months building domain-specific data models from scratch—entity resolution across asset names, tag normalization, hierarchy mapping—and often abandon the effort before analytics produces value .
What Industrial DataOps Changes
Industrial DataOps applies DevOps, Agile, and Lean principles to manufacturing data pipelines, with adaptations for the latency, determinism, and safety constraints of operational technology environments . It is not a single tool or platform. It is a discipline that connects, standardizes, contextualizes, and governs data so that analytics and AI can consume it reliably.
The core distinction from traditional IT data management is that Industrial DataOps treats data integration as a continuous, automated process rather than a project. When a new analytics application needs plant floor data, it connects to governed data products instead of building a new point-to-point integration . This shift matters because point-to-point integration creates combinatorial complexity: with N systems, potential interfaces approach N(N-1)/2, and each new integration becomes harder to maintain than the last .
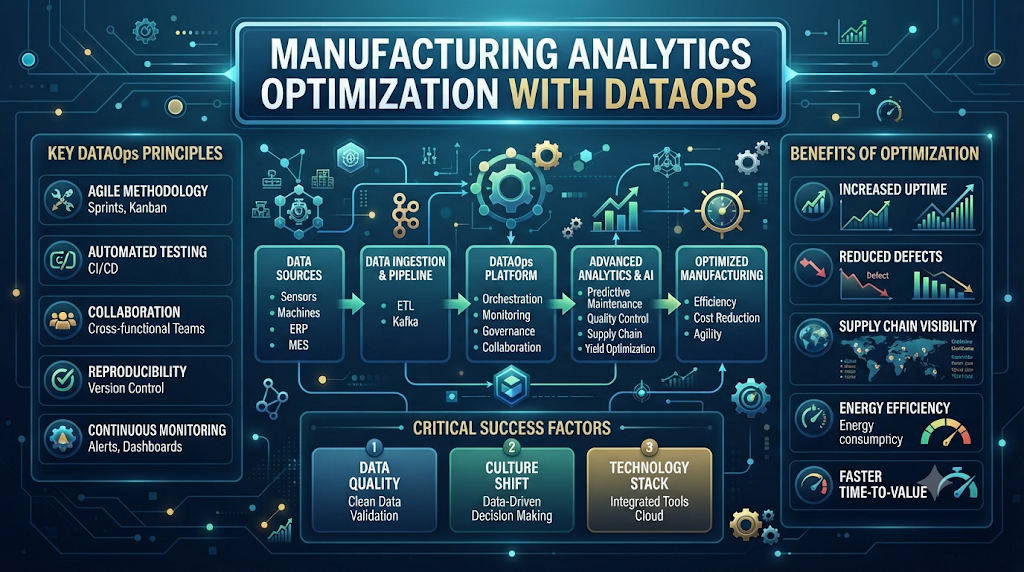
A practical Industrial DataOps pipeline typically includes five stages: connect to OT sources, standardize units and timestamps, contextualize tags to equipment and process meaning, publish through a consistent structure (often a Unified Namespace), and govern access and quality . Each stage builds on the previous one. Skipping contextualization produces clean but meaningless data; skipping governance produces a system that no one trusts.
The Practical Path: Start with One Painful Problem
Manufacturers that succeed with DataOps do not begin with enterprise-wide transformation. They begin by answering a simple question: is there real value in the data we already have ?
Actemium Avanceon’s DataOps approach illustrates this incremental logic. The first phase focuses on accessing and organizing data from existing OT systems—connecting to historians, MES, and control systems, aligning data across systems by time and events, and establishing vendor-neutral connectivity using OPC UA, MQTT, and APIs . The objective is to make data available without disrupting operations.
The second phase adds context: mapping tags to process meaning, defining production states, aligning data to equipment and batches, and structuring data into a process-oriented model . Without this step, even advanced analytics or AI produce incomplete or misleading results because the data does not reflect how the process actually operates.
Only then does analysis begin—identifying sources of variability, understanding relationships between process variables, and validating assumptions with real plant data. Predictive models and anomaly detection come after the foundation is validated .
For a first project, a thirty-day pilot with numeric acceptance criteria is a reasonable scope. Coverage criteria confirm every in-scope signal is mapped or explicitly excluded. Quality criteria define source-to-consumer latency, completeness, and freshness thresholds. Resilience criteria test whether the pipeline survives an uplink disconnection or an edge node restart. Reuse criteria—most often omitted—confirm that the model can be redeployed to a second line without rebuilding from scratch .
Where DataOps Produces Measurable Manufacturing Outcomes
The value case for Industrial DataOps is strongest when tied to a specific operational KPI. Three areas consistently show returns.
Quality analytics. Mapping quality data to production conditions enables correlation analysis that identifies which process variables predict which defect types. A vision inspection system logging every defect by type, location, and time, connected through the DataOps pipeline to process data from the same period, allows engineers to address root causes rather than detecting symptoms after the fact .
Predictive maintenance. Vibration, thermal, and acoustic sensors generate data that only becomes actionable when contextualized against asset hierarchy, maintenance history, and failure modes. A DataOps layer that links sensor readings to the specific asset and its FMEA library turns a generic threshold alert into a failure prediction that a maintenance planner can act on .
OEE and performance visibility. Real-time overall equipment effectiveness requires aggregating production counts, downtime events, and speed data from multiple systems. When the DataOps pipeline publishes a governed OEE dataset, operations and engineering teams work from the same numbers rather than reconciling spreadsheets .
One documented implementation at a manufacturing operator with fragmented SCADA, quality system, and spreadsheet-based maintenance records produced real-time OEE visibility without manual compilation and provided the data foundation for a predictive maintenance pilot within three months of go-live .
Failure Modes That Derail Manufacturing DataOps
Starting with AI instead of data foundations. AI initiatives that begin before contextualization and quality validation produce models trained on data that does not reflect process reality. The result is limited adoption and unclear ROI . The sequence must be: connect, contextualize, validate, then model.
Treating a Unified Namespace as the entire strategy. A UNS is a critical organizing structure, but it is one component of Industrial DataOps, not the whole discipline. Organizations that implement a UNS without governance, quality validation, or a plan for enterprise-wide consistency end up with isolated site-level namespaces that are not unified across the company .
Skipping reuse criteria in pilots. A pilot that passes coverage and quality but fails reuse has delivered a working integration, not a scalable architecture. Scale-out will cost per site what the pilot cost, and the program loses momentum . The semantic model that persists after the pilot must have a named owner, or it drifts as soon as a second site adapts it.
Automating without monitoring. Automated data quality checks that generate false alarms that analysts learn to ignore are worse than no checks, because they consume attention without building trust. Data observability is an ongoing operational function, not a launch deliverable .
How to Validate That DataOps Is Working
Before-and-after metrics on a single production line provide the clearest evidence. Track time from data source change to downstream availability, frequency of manual data preparation for analytics, number of data quality exceptions that reach the analytics layer, and whether a second line can be onboarded using the same model within days rather than weeks .
The broader indicator is whether analysts spend their time analyzing rather than preparing data. If the DataOps pipeline is functioning, the proportion of analyst time spent on cleaning and reconciliation should decline measurably within the first quarter of operation .
Frequently Asked Questions
Q1. What is Industrial DataOps?
Industrial DataOps applies DevOps, Agile, and Lean principles to manufacturing data pipelines, with adaptations for OT environments. It connects, standardizes, contextualizes, and governs data so analytics and AI can consume it reliably .
Q2. How is Industrial DataOps different from regular DataOps?
Industrial DataOps must handle proprietary OT protocols, intermittent connectivity, safety constraints, and equipment hierarchies that IT data does not have. The principles are similar, but the implementation must account for plant floor realities .
Q3. Do I need a Unified Namespace to do Industrial DataOps?
A UNS is a common and useful organizing structure, but it is one component, not the whole discipline. Governance, quality validation, and semantic modeling are equally essential .
Q4. Where should a manufacturer start with DataOps?
Start with one painful, visible problem on one production line. Define numeric acceptance criteria for coverage, quality, resilience, and reuse, then run a thirty-day pilot before scaling .
Q5. How long does an Industrial DataOps pilot take?
A focused pilot with defined scope can complete in thirty days. The first week establishes the model and connections, the second contextualizes, the third distributes to a real consumer, and the fourth measures against acceptance criteria .
Q6. Can DataOps work with legacy equipment?
Yes. Industrial DataOps is designed to work with existing historians, PLCs, and SCADA systems without rip-and-replace. Edge gateways normalize legacy protocols before data reaches the analytics layer .
Q7. What metrics show that DataOps is delivering value?
Track source-to-consumer data latency, manual data preparation time, quality exceptions reaching analytics, and time to onboard a second production line. These are more actionable than broad data quality scores .
Q8. Why do manufacturing AI projects fail without DataOps?
Without contextualized, validated data, AI models train on signals that do not reflect actual process behavior. The models may work in controlled pilots but fail to scale because the underlying data foundation is inconsistent across lines and sites .
Q9. Who should own the data model after a pilot?
A named owner must be assigned before the pilot ends. Without ownership, the semantic model drifts as soon as a second site adapts it, and the reuse benefit that justified the program disappears .
Q10. How does DataOps support predictive maintenance?
DataOps links sensor data to asset hierarchy, maintenance history, and failure mode libraries. This contextualization turns a raw vibration reading into a failure prediction that a planner can act on .
Conclusion
Manufacturing analytics optimization with DataOps is not a platform purchase. It is a sequence: connect to existing OT data, contextualize it against real process behavior, validate quality before modeling, and prove value on one line before scaling. The plants that succeed treat data foundation work as the enabler of analytics, not a barrier to it. Start by auditing one production line’s data pipeline this week—identify where context is lost and what manual work fills the gap. That audit will reveal the first pilot worth running.
