Introduction
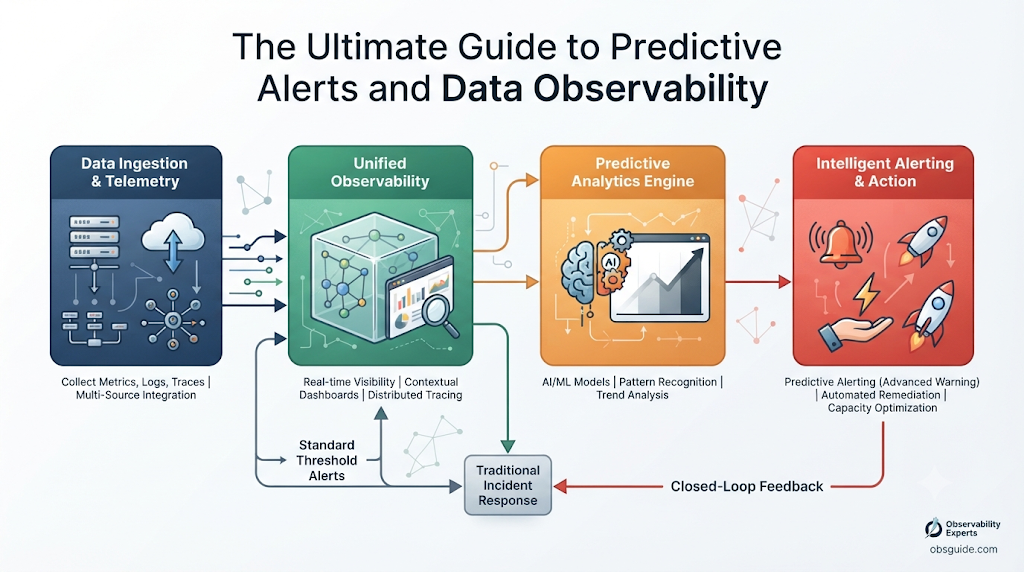
In modern data-driven enterprises, data pipelines serve as the central circulatory system of business intelligence, operational analytics, machine learning platforms, and executive decision-making. However, as data architectures transition to multi-cloud environments, distributed ELT framework structures, and real-time streaming engines, maintaining data pipeline reliability has become exceptionally complex. To combat silent data failures, modern data teams are moving beyond basic status-check monitoring toward Predictive Alert Tools and Data Observability platforms. These AI-driven systems continuously monitor pipeline telemetry, learn historical statistical patterns, detect anomalies before they propagate downstream, and forecast potential infrastructure bottlenecks. At TheDataOps.org, an educational platform dedicated to DataOps engineering, data observability, and enterprise data architecture, understanding predictive alert tools is viewed as a fundamental requirement for building resilient, self-healing data ecosystems.
What Are Predictive Alert Tools?
Predictive Alert Tools are specialized software solutions designed to monitor, analyze, and forecast the health, structure, and quality of data flowing through modern data pipelines in real time. Unlike legacy alerting systems that only fire after a job explicitly fails or a row count crosses a fixed numerical threshold, predictive alert platforms leverage historical metadata, statistical profiling, and machine learning models to detect subtle deviations and predict incoming system failures.
+-----------------------------------------------------------------------------------+
|                           PREDICTIVE ALERT TOOL ENGINE                             |
|                                                                                   |
|  Telemetry Ingestion      Statistical ML Models          Proactive Output         |
|  +------------------+     +--------------------+     +-----------------------+    |
|  | Metadata Logs    | --> | Time-Series (Prophet)| -> | Early Slack/PagerDuty |    |
|  | Schema Drift     |     | Isolation Forests  |     | Anomaly Alerts        |    |
|  | Query Performance|     | Seasonal Adjustment|     | Root Cause Lineage    |    |
|  +------------------+     +--------------------+     +-----------------------+    |
+-----------------------------------------------------------------------------------+
In a typical enterprise setup, predictive alert tools sit alongside cloud data warehouses, orchestration platforms, and transformation engines. They analyze the metadata generated by these platforms—such as execution times, row counts, table freshness, schema alterations, and null distribution rates—without requiring engineers to inspect raw customer data directly.
By continuously evaluating historical runtime patterns and variance cycles, a predictive alert tool can distinguish between expected operational changes (such as a predictable 300% spike in transactions during Black Friday) and genuine operational anomalies (such as a 40% drop in ingestion volume caused by an upstream API change).
Why Predictive Alerts Matter in Modern DataOps
Data Operations (DataOps) applies Agile development, DevOps principles, and Lean manufacturing disciplines to data delivery pipelines. The ultimate objective of DataOps is to accelerate time-to-insight while maintaining low defect rates and high data reliability.
Predictive alerts play a crucial role in modern DataOps for several key reasons:
1. Eliminating Silent Data Outages
A silent data outage occurs when a pipeline continues executing successfully (returning HTTP status 200 or exit code 0) even though the underlying dataset is incomplete, corrupted, or stale. Standard orchestrators do not catch these issues because the task technically succeeded. Predictive alert tools examine dataset telemetry to spot missing rows, unexpected null spikes, or schema mutations instantly.
2. Reducing Mean Time to Detection (MTTD) and Resolution (MTTR)
In legacy data setups, the Mean Time to Detection (MTTD) for data errors is often measured in days or weeks—frequently discovered only when business stakeholders report inaccurate figures. Predictive alerting reduces MTTD from days to seconds by surfacing automated, context-aware notifications the moment statistical anomalies occur.
3. Preventing Alert Fatigue
When data engineering teams configure hundreds of static threshold alerts (e.g., “Alert if table row count < 10,000”), normal business variability triggers constant false alarms. Engineers eventually tune out these notifications—a phenomenon known as alert fatigue. Predictive alert tools adapt dynamically to seasonal patterns, holiday shifts, and natural growth trends, keeping notifications actionable and highly accurate.
How Predictive Alert Tools Work
To understand how predictive alert platforms operate under the hood, it helps to examine their core execution lifecycle:
[ Metadata & Query Log Ingestion ]
              │
              ▼
[ Automated Profiling & Telemetry Baseline ]
              │
              ▼
[ Machine Learning Anomaly Detection ]
              │
              ▼
[ Root Cause Analysis via Data Lineage ]
              │
              ▼
[ Dynamic Alerting & Auto-Remediation Trigger ]
- Metadata Ingestion: The predictive alert engine connects to query logs, data warehouse information schemas, orchestrator execution history (e.g., Apache Airflow, Dagster), and API ingestion endpoints.
- Automated Profiling: The platform establishes baseline profiles across key metrics, including table update frequency, query execution latency, memory utilization, table size, and column-level distributions.
- Machine Learning Scoring: The tool evaluates incoming telemetry against trained statistical models (such as ARIMA, Prophet, or Isolation Forests). If the measured value falls outside predicted confidence intervals, an anomaly score is calculated.
- Lineage Mapping & Root Cause Analysis: If the anomaly score exceeds safety parameters, the engine traverses the data lineage graph upstream to isolate where the schema change or volume drop originated.
- Contextual Alert Dispatch: The system formats an alert complete with diagnostic context, affected downstream dependencies, and probable root causes, then routes it via Slack, Microsoft Teams, PagerDuty, or Webhooks.
Role of AI and Machine Learning in Predictive Alerts
Artificial Intelligence and Machine Learning form the technical backbone of modern predictive monitoring. Static rules fail in dynamic enterprise data environments because corporate data naturally scales, shifts schema structures, and varies according to business cycles.
       STATIC THRESHOLDS                        PREDICTIVE AI MODELS
+-------------------------------+       +----------------------------------+
| Fixed Upper Limit ----------- |       | Upper Bound  - - - - - - - - - - |
| Actual Value   ~~~~~~~~~~~~~~ |       | Actual Value ~~~~~~~~~~~~~~~~~~  |
| Fixed Lower Limit ----------- |       | Lower Bound  - - - - - - - - - - |
+-------------------------------+       +----------------------------------+
  Fails to account for seasonality,        Dynamically adjusts to patterns,
  leading to frequent false alarms.        growth trends, and weekly cycles.
DataOps platforms apply specialized AI algorithms to telemetry datasets to enable intelligent alerting:
- Time-Series Forecasting (e.g., Facebook Prophet, Holt-Winters): Models seasonal trends, day-of-week fluctuations, and monthly spikes to establish dynamic upper and lower statistical boundaries for data freshness and volume.
- Unsupervised Anomaly Detection (e.g., Isolation Forests, DBScan): Groups multi-dimensional column distributions (such as mean, median, standard deviation, and null counts) to flag unexpected data distribution drifts without requiring manual labeled training data.
- Machine Learning Lineage Propagation: Predicts downstream blast radiuses by combining pipeline graph structures with historical failure probabilities, helping teams prioritize critical alerts over minor system notices.
Predictive Alerts vs. Traditional Monitoring
Understanding the differences between legacy monitoring and predictive observability is essential for modernizing data operations.
| Feature / Dimension | Traditional Monitoring | AI-Powered Predictive Alerts |
| Detection Approach | Reactive (post-failure) | Proactive and Predictive |
| Configuration | Manual SQL scripts, hardcoded thresholds | Automated baseline profiling and continuous ML learning |
| Scope of Coverage | Basic infrastructure health (CPU, Job Exit Codes) | End-to-end Data Observability (Freshness, Volume, Schema, Distribution, Lineage) |
| Handling Seasonality | Rigid; fails on holidays or rapid business growth | Adaptive; automatically handles cyclical trends |
| False Positive Rates | High (leads to severe alert fatigue) | Low (filters normal operational variations) |
| Root Cause Isolation | Manual diagnostic log searching | Automated graph-based lineage mapping |
| Target Audience | System Administrators, Infrastructure DevOps | Data Engineers, Analytics Engineers, Data Scientists, BI Teams |
Understanding Data Observability
Predictive alert tools are part of the broader domain of Data Observability. While traditional data quality tests confirm whether data conforms to known rules (e.g., “Check if user_id is NOT NULL”), data observability provides total visibility into system health, surfacing unknown failure modes.
As taught across TheDataOps.org learning modules, complete data observability relies on Five Core Pillars:
                       +-----------------------------------+
                       |    5 PILLARS OF OBSERVABILITY    |
                       +-----------------------------------+
                                         |
     ┌──────────────────┬────────────────┼────────────────┬──────────────────┐
     ▼                  ▼                ▼                ▼                  ▼
[ FRESHNESS ]      [ VOLUME ]       [ SCHEMA ]      [ DISTRIBUTION ]    [ LINEAGE ]
Is data arriving   Are row counts   Have columns     Are statistical     How does data
on schedule?       within bounds?   changed/drifted? metrics normal?     flow end-to-end?
- Freshness: Tracks how up-to-date data tables are and alerts when downstream tables miss scheduled ingestion windows.
- Volume: Monitors table row counts and data intake volume to flag unexpected drops, record duplications, or pipeline blockages.
- Schema: Detects structural changes—such as dropped columns, renamed fields, or altered type definitions—that break downstream transformation models.
- Distribution: Analyzes column-level statistical properties (e.g., null percentages, value frequencies, string lengths) to identify semantic corruption.
- Lineage: Maps upstream sources to downstream consumption points (BI dashboards, ML endpoints), enabling instant impact analysis when an anomaly occurs.
Detecting Anomalies Before They Impact Business
Anomalies in operational data systems rarely trigger loud system crashes; instead, they usually manifest as subtle numerical inconsistencies. Consider an e-commerce enterprise processing millions of transactions daily:
Scenario: An upstream web engineering team updates a payment service API, changing the output field
payment_statusfrom lowercase strings ("success","failed") to uppercase strings ("SUCCESS","FAILED").
- With Traditional Monitoring: The ELT pipeline executes without error. SQL models containing
WHERE payment_status = 'success'quietly process 0 records. Executive BI dashboards show zero revenue for the day, triggering emergency calls hours later. - With Predictive Alert Tools: The anomaly detection engine notices that the distinct value distribution of
payment_statushas suddenly shifted, while the string length profile mutated. A critical warning is sent to Slack within 3 minutes of ingestion:
⚠️ Predictive Alert: Distribution Anomaly Detected
- Table:
raw_analytics.payment_events- Metric: Unrecognized distinct values detected in column
payment_status("SUCCESS").- Blast Radius: 4 downstream dbt models and 2 Tableau Executive Dashboards impacted.
- Suggested Action: Update downstream transformation regex rules or roll back API release.
Predictive Alerts in ETL and ELT Pipelines
The structural transition from legacy ETL (Extract, Transform, Load) to modern cloud-native ELT (Extract, Load, Transform) has fundamentally reshaped pipeline architectures. In ELT environments, raw data is loaded directly into scalable data warehouses (e.g., Snowflake, BigQuery) before transformation jobs run.
ETL (Extract -> Transform -> Load)
[ Source ] ──> [ ETL Compute Server ] ──> [ Target Database ]
                     │
              (Alerts check server resources & job status)

ELT (Extract -> Load -> Transform)
[ Source ] ──> [ Cloud Warehouse ] ──> [ In-Warehouse Transformations (dbt) ]
                      │                                 │
              (Predictive Alerts)              (Predictive Alerts)
              • Raw Volume Drops               • Schema Drifts
              • Ingestion Latency              • Value Distribution Shifts
Predictive alert tools support both frameworks by monitoring distinct operational layers:
- Extract & Load Stage: Tracks source connector health, API rate limits, schema evolutions, and ingestion latencies. If an API vendor silently changes payload formats, predictive tools alert engineers before raw tables accumulate corrupted partitions.
- Transformation Stage (dbt, SQL): Monitors materialization execution times, query cost spikes, memory utilization, and non-null integrity. If a SQL join produces a Cartesian product, the predictive tool flags the massive row count explosion mid-execution.
Monitoring Data Quality Using Predictive Alerts
Traditional Data Quality (DQ) management relied on static assertion frameworks like Great Expectations, dbt tests, or custom SQL checks. While valuable, writing declarative rules manually for tens of thousands of enterprise tables is mathematically impossible and unmaintainable.
Predictive alert systems upgrade data quality monitoring through Automated Adaptive Testing:
Declarative DQ (dbt tests)    ───►   Covers Known Failures ("Is Null?")
                                             ┼
Predictive ML Observability   ───►   Covers Unknown Failures ("Data Drift?")
                                             │
                                             ▼
                             100% Comprehensive Data Coverage
- Dynamic Data Profiling: Automatically infers quality bounds based on historical distributions without requiring manual configurations.
- Categorical Drift Tracking: Flags when string field categories expand or contract beyond normal variance parameters.
- Numerical Outlier Detection: Employs Z-Score and Interquartile Range (IQR) models to catch erroneous numerical spikes (such as a pricing column accidentally logged in cents instead of dollars).
Real-Time Pipeline Monitoring
As modern organizations adopt event-driven architectures powered by Apache Kafka, AWS Kinesis, and Apache Flink, batch monitoring approaches are no longer sufficient. Real-time streaming applications require instantaneous, low-latency anomaly detection.
Predictive alert platforms integrate directly with streaming brokers and real-time processing frameworks:
- Kafka Consumer Lag Monitoring: Predicts consumer group processing delays before topic queues back up, enabling autoscaling mechanisms.
- Windowed Volume Analysis: Measures micro-batch event arrivals against sliding time windows to detect sudden network drops or source infrastructure outages.
- Payload Structural Profiling: Inspects real-time JSON payloads for missing keys or unexpected data type mutations before writing records to target storage layers.
Forecasting Data Pipeline Failures
The true power of predictive alert tools lies in their ability to move beyond real-time detection into future capacity and failure forecasting.
+-------------------------------------------------------------------------------+
|                       PROACTIVE CAPACITY & FAILURE FORECAST                   |
|                                                                               |
|  [ Storage Growth Trend ]  ───►  Predicts Warehouse Disk Saturation in 6 Days |
|  [ Execution Time Drift ]  ───►  Predicts Orchestrator Timeout in 2 Runs      |
|  [ API Rate Limit Usage ]  ───►  Predicts Ingestion Throttling in 45 Minutes  |
+-------------------------------------------------------------------------------+
By processing historical performance logs over time, predictive observability engines forecast operational bottlenecks before they occur:
- Storage and Warehouse Compute Forecasting: Analyzes database growth curves to notify engineers when storage limits or warehouse credit quotas will be exhausted weeks in advance.
- Runtime Duration Drift: Detects gradual performance degradation in recurring transformation jobs (e.g., a query whose execution time increases by 2% daily due to missing index partition pruning), alerting teams before the job exceeds orchestrator SLA timeout limits.
- Upstream Infrastructure Capacity Warnings: Evaluates API response latency distributions from third-party data providers, predicting upstream service degradation before data ingestion drops completely.
Popular Predictive Alert Tools and Platforms
The DataOps and data observability market contains several enterprise platforms, each optimized for specific architectural needs. Below is a detailed technical comparison:
| Platform | Core Focus / Features | Common Use Cases | Key Integrations | Primary Business Benefits |
| Monte Carlo | End-to-end Data Observability, ML-driven freshness, volume, and schema monitoring | Enterprise cloud data warehouse observability & automated lineage tracing | Snowflake, Databricks, BigQuery, dbt, Airflow, Tableau | Drastically lowers MTTD/MTTR; provides zero-setup baseline coverage |
| Datadog Data Observability | Unified APM, infrastructure, and data pipeline monitoring engine | Hybrid cloud IT monitoring, pipeline compute tracking, unified DevOps/DataOps | AWS, Azure, GCP, Kubernetes, Kafka, Snowflake | Correlates database compute performance directly with data pipeline health |
| Acceldata | Enterprise Data Observability across compute, pipeline, and data quality domains | Large-scale multi-cloud and hybrid Hadoop/Spark infrastructure optimization | Apache Spark, Kafka, Snowflake, Databricks, Hive | Optimizes cloud compute costs while maintaining pipeline reliability |
| Bigeye | Deep data quality profiling, column distribution tracking, dynamic SLA alerting | Automated data quality verification for high-volume transactional tables | Snowflake, Redshift, BigQuery, Postgres, dbt | Eliminates manual DQ assertion writing; detects distribution shifts |
| Soda | Hybrid data quality testing and automated anomaly detection framework | Developer-first pipeline validation within dbt and CI/CD workflows | dbt, Snowflake, Airflow, Spark, GitHub Actions | Unifies programmatic data testing with ML-driven threshold checks |
Integration with Cloud Data Platforms
Modern predictive alert tools do not operate in isolation—they connect seamlessly to cloud data platforms via native service integrations, metadata APIs, and query log streams.
                             +------------------------+
                             | PREDICTIVE ALERT TOOL  |
                             +------------------------+
                                         ▲
         ┌───────────────────────────────┼───────────────────────────────┐
         │ Metadata API                  │ Information Schemas           │ Telemetry
         ▼                               ▼                               ▼
+-----------------+             +-----------------+             +-----------------+
|    SNOWFLAKE    |             |   DATABRICKS    |             | GOOGLE BIGQUERY |
|  Query History  |             |  Unity Catalog  |             |  Audit Logs     |
| System Metadata |             | Delta Lake Logs |             | Information Schema|
+-----------------+             +-----------------+             +-----------------+
1. Snowflake
Predictive tools query Snowflake’s ACCOUNT_USAGE and INFORMATION_SCHEMA views to monitor table size, partition updates, warehouse credit burn rates, and query runtimes without impacting warehouse performance or incurring heavy query fees.
2. Databricks
By integrating directly with Databricks Unity Catalog and Delta Lake transaction logs, predictive monitoring platforms analyze file modification metrics, schema evolutions, and Spark job execution plans in real time.
3. Google BigQuery
Predictive alert tools connect to BigQuery’s INFORMATION_SCHEMA.JOBS_BY_PROJECT and audit logs to monitor query byte limits, partition freshness, and streaming ingestion slot allocations.
Predictive Alerts for Business Intelligence and Analytics
The ultimate consumers of enterprise data are Business Intelligence (BI) dashboards and executive reporting suites. When data issues breach raw transformation layers, they compromise executive decision-making.
Predictive alert tools safeguard BI environments in two major ways:
[ Raw Ingestion ] ──► [ Transformation ] ──► [ Semantic Model ] ──► [ BI Dashboards ]
                                                                             │
 Predictive Alert Triggers ──────────────────────────────────────────────────┘
   • Flags stale metrics on dashboards.
   • Suppresses downstream report updates automatically.
   • Displays context banners: "Warning: Data refreshing in progress."
- Downstream Dashboard Lineage Tracking: By mapping column-level data lineage from data warehouses directly into Tableau, Power BI, or Looker, predictive alert tools immediately highlight which executive dashboards are impacted by an upstream anomaly.
- Proactive Alert Banners: Advanced tools can automatically update BI dashboard metadata or send warnings to analytical end-users, informing them that a specific report is undergoing data remediation—preventing executives from making business decisions based on stale or incomplete data.
Real-World Enterprise Use Cases
To demonstrate the business value of predictive alert tools, let’s look at three practical enterprise implementations:
Scenario A: Financial Services Fraud Detection
- Challenge: A global payment processor ingests 50 million transaction events daily. An upstream database migration accidentally truncated transaction timestamps to midnight (
00:00:00), corrupting intra-day real-time fraud detection models. - Predictive Solution: The predictive alert platform flagged a distribution anomaly—noticing that variance in the
transaction_timestampfield dropped to zero. - Outcome: Engineers received an emergency PagerDuty notification within 4 minutes. The pipeline was paused, preventing false fraud alerts across thousands of customer accounts.
Scenario B: E-Commerce Inventory Supply Chain
- Challenge: A major retailer relies on automated daily ELT jobs to restock regional fulfillment warehouses. An upstream supplier changed vendor product IDs, causing a join operation to drop 30% of inventory records silently.
- Predictive Solution: The predictive tool’s time-series model identified an unexpected 30% volume drop on a Tuesday morning—a day that historically showed consistent volume.
- Outcome: The supply chain data team received an alert with the exact missing join keys mapped out. The issue was patched before warehouse procurement orders were generated.
Scenario C: Healthcare Analytics & Regulatory Reporting
- Challenge: A healthcare provider aggregates patient telemetry data across multi-cloud infrastructure. An ingestion pipeline encountered network latency, causing batch syncs to arrive 3 hours late.
- Predictive Solution: The predictive alert tool analyzed historical arrival times and flagged a freshness violation before patient compliance reports were compiled.
- Outcome: The platform automatically notified hospital administrators that compliance metrics were pending updated ingestion, ensuring full regulatory accuracy.
Benefits of Predictive Alert Tools
Adopting AI-driven predictive monitoring offers tangible technical and financial benefits for data-driven enterprises:
+----------------------------------------------------------------------------------+
|                   KEY BENEFITS OF PREDICTIVE ALERT TOOLS                         |
|                                                                                  |
|  [ Higher Data Trust ]       [ 80% MTTD Reduction ]    [ Zero Alert Fatigue ]     |
|  Stakeholders make           Issues caught in minutes  Only actionable,           |
|  confident decisions.        instead of days.          context-aware alerts.      |
|                                                                                  |
|  [ SLA Compliance ]          [ Lower Cloud Costs ]     [ Automated Lineage ]      |
|  Consistently hit business   Prevents runaway query    Instant root-cause         |
|  freshness targets.          compute billing.          blast radius mapping.      |
+----------------------------------------------------------------------------------+
- Maximum Data Trust: Stakeholders across executive, operational, and analytical departments can trust the dashboards and ML endpoints powering their work.
- Drastic MTTD and MTTR Reduction: Organizations routinely report an 80% reduction in Mean Time to Detection and a 60% drop in Mean Time to Resolution after deploying predictive observability.
- Elimination of Alert Fatigue: By using dynamic statistical bounds instead of static rules, on-call data engineers receive far fewer false alarms.
- SLA and SLO Enforcement: Enables data teams to define, track, and adhere to strict Data Service Level Agreements (SLAs) with business consumers.
- Cloud Infrastructure Cost Optimization: Catching runaway Cartesian joins, failed looping tasks, or unindexed queries early prevents unexpected cloud data warehouse billing spikes.
Common Challenges and Limitations
While predictive alert tools offer substantial value, organizations must navigate several operational and technical challenges during deployment:
- Cold Start Problem: Machine learning models require 14 to 30 days of historical metadata telemetry to learn seasonal baselines and normal variance cycles. Early deployments can trigger false alarms until the baseline matures.
- High Metadata Storage Costs: Continuously logging and profiling enterprise-scale data warehouses can consume notable storage and compute resources if profiling schedules are not properly optimized.
- Complex Distributed Lineage Integration: In legacy architectures containing custom Python scripts, unparsed stored procedures, or legacy ETL tools, building automated end-to-end data lineage requires significant initial engineering effort.
- Organizational Resistance and Operational Silos: Moving from reactive fire-fighting to proactive DataOps requires operational alignment between data engineers, business analysts, and infrastructure DevOps teams.
Best Practices for Implementing Predictive Alerts
To maximize return on investment when deploying predictive alert platforms, DataOps leaders should follow these proven implementation strategies:
STEP 1: Identify Critical Assets  ──► Focus on Tier-1 BI & ML Tables First
STEP 2: Automated Baselining      ──► Allow ML Models 14-30 Days to Mature
STEP 3: Configure Severity Levels ──► Low (Slack) vs. Critical (PagerDuty)
STEP 4: Integrate Lineage Graph   ──► Map Upstream & Downstream Dependencies
STEP 5: Establish Remediation     ──► Write Automated Runbooks & Auto-Retries
- Prioritize Tier-1 Data Assets First: Do not attempt to profile every temporary sandbox table on day one. Focus predictive alerting on core analytical models, financial marts, and production ML feature stores.
- Establish Clear Alert Severity Tiers:
- Critical (P1): Downstream executive reporting or production ML models broken -> PagerDuty alert to on-call engineer.
- Warning (P2): Non-critical schema drift or minor volume delay -> Notification to team Slack channel.
- Info (P3): General performance optimization recommendation -> Logged to internal tracking board.
- Combine ML Detection with Explicit Rules: Use machine learning for volume, freshness, and distribution drifts, but complement it with explicit business logic assertions (e.g., “Country code must match ISO standards”).
- Enforce Root Cause Runbooks: Ensure every alert notification includes direct links to relevant table lineage, query history logs, and operational runbooks so on-call engineers can resolve issues quickly.
Common Mistakes Organizations Should Avoid
When transitioning to predictive data monitoring, organizations often fall into several predictable traps:
- Over-Alerting on Raw Landing Zones: Setting aggressive anomaly detection sensitivity on unstable, uncleaned raw staging layers causes unnecessary notifications. Focus primary alerting on curated transformation models.
- Ignoring Data Lineage Mapping: Deploying predictive alerts without underlying lineage tracking forces engineers to troubleshoot issues manually, defeating the purpose of automated observability.
- Treating Observability as a Tool Rather Than a Process: Buying an expensive data observability platform without establishing clear team ownership, on-call rotations, and remediation SLAs leads to shelfware.
- Failing to Tune Baseline Models: Neglecting to inform predictive tools about known, planned business events (e.g., marketing campaigns or product launches) causes systems to flag expected growth as operational anomalies.
Future Trends in AI-Powered Data Monitoring
The data observability and DataOps landscape is evolving rapidly. Over the next few years, several major technological developments will transform how predictive alert tools operate:
+----------------------------------------------------------------------------------+
|                     FUTURE TRENDS IN PREDICTIVE DATAOPS                          |
|                                                                                  |
|  [ Generative AI Root Cause ]   ──► Explains pipeline failures in plain English. |
|  [ Autonomous Remediation ]     ──► Self-healing data pipelines auto-fix bugs.   |
|  [ FinOps Observability ]       ──► Correlates schema changes with query costs.   |
|  [ Real-Time Micro-Profiling ]  ──► Sub-second anomaly checks for streaming.     |
+----------------------------------------------------------------------------------+
- Generative AI Diagnostics and Plain-English Alerts: Predictive systems will use large language models (LLMs) to analyze failed execution logs, code diffs, and query histories, returning natural language diagnostic summaries (e.g., “Job failed because line 42 in
orders.sqlexpected integer but received string”). - Autonomous Self-Healing Pipelines: The industry is moving from predictive alerting toward autonomous remediation. Future DataOps engines will automatically apply patch rules, adjust warehouse compute scales, or roll back breaking schema deployments without human intervention.
- Integrated FinOps and Cost Observability: Predictive platforms will dynamically link statistical profiling with cloud infrastructure cost tracking, warning teams when specific dbt SQL transformation changes will increase warehouse billing by 50% before deployment.
- Sub-Second Streaming Observability: As edge computing and real-time streaming architectures expand, anomaly detection engines will operate at sub-second latencies directly inside event brokers.
Skills Required for DataOps Professionals
As predictive alerting and automated data observability become standard enterprise practices, the core skill sets required for data engineers and DataOps professionals are evolving. Modern practitioners need expertise across several key disciplines:
+-----------------------------------------------------------------------------------+
|                       DATAOPS PROFESSIONAL SKILL MATRIX                           |
|                                                                                   |
|  [ Telemetry & Observability ] ──► Monte Carlo, Datadog, Bigeye, Soda |
|  [ Ingestion & Transformation] ──► Fivetran, Airbyte, dbt, SQL               |
|  [ Cloud Platforms & Storage ] ──► Snowflake, Databricks, BigQuery         |
|  [ Orchestration & CI/CD ]     ──► Airflow, Dagster, GitHub Actions        |
|  [ Applied Machine Learning ]  ──► Time-series models, Anomaly detection |
+-----------------------------------------------------------------------------------+
- Data Observability Frameworks: Hands-on experience configuring platforms like Monte Carlo, Bigeye, Soda, or Datadog Data Observability.
- Modern Orchestration and ELT: Proficiency with dbt, Apache Airflow, Dagster, Fivetran, and Airbyte.
- Cloud Architecture and Metadata Systems: Deep understanding of Snowflake, Databricks Unity Catalog, BigQuery, and transactional metadata systems.
- Applied Statistics and Machine Learning Basics: Understanding time-series forecasting models (Prophet, ARIMA), Isolation Forests, Z-score distributions, and regression analysis.
- Data Governance and Lineage Mapping: Experience implementing automated column-level data lineage and enterprise metadata policies.
Frequently Asked Questions
1. What is the main difference between data monitoring and data observability?
Data monitoring tracks known metrics and explicit system failures (such as job crashes or HTTP errors). Data observability uses telemetry, statistical profiling, and machine learning to surface unknown operational problems, explain why errors occurred, and map their downstream business impact.
2. How do predictive alert tools learn what constitutes “normal” data?
Predictive alert tools analyze historical metadata over time (typically requiring 14 to 30 days). They apply statistical machine learning models—such as time-series forecasting—to establish moving confidence bands around parameters like data freshness, volume, and value distributions.
3. Can predictive alert tools run without querying sensitive raw customer data?
Yes. Modern predictive alert and data observability tools inspect query execution logs, database information schemas, table metadata, and orchestrator execution metrics. They do not need to read or store sensitive underlying customer PII records to perform anomaly detection.
4. How do predictive alert tools help reduce cloud warehouse billing?
Unintended Cartesian joins, unindexed query loops, or corrupted infinite ingestion retries can consume thousands of dollars in cloud warehouse compute credits. Predictive alert tools monitor query execution runtimes and row volumes in real time, alerting engineers to kill runaway processes early.
5. What is a “silent data outage”?
A silent data outage occurs when a data pipeline finishes executing successfully with no error codes, but the underlying data is incomplete, corrupted, or stale. End users only discover these issues when BI dashboards or analytical reports display incorrect figures.
6. Are predictive alert tools suitable for small data teams?
Yes. Small data teams often benefit the most from predictive alert platforms because they lack the time to write manual data quality tests for every pipeline. Automated baseline profiling allows small teams to monitor extensive data environments efficiently.
7. How do predictive alerts handle holiday sales spikes or seasonal variations?
Unlike static threshold rules, AI-driven predictive alert tools incorporate time-series models (such as Prophet) that automatically adjust for day-of-week trends, monthly business cycles, and holiday variations—preventing unnecessary false alarms during high-volume periods.
8. What role does data lineage play in predictive alerting?
Data lineage visualizes how raw datasets flow through upstream transformations into downstream consumption endpoints like dashboards and ML models. When a predictive alert triggers, lineage mapping immediately surfaces the root cause and pinpoints affected downstream systems.
9. Can predictive alert tools prevent breaking schema changes?
Yes. Predictive alert platforms monitor table structure evolutions in real time. If an upstream software release drops a column, renames a field, or changes a data type, the predictive tool alerts engineers before those changes break downstream dbt transformation models.
10. How do I choose between building a custom monitoring tool or buying a commercial platform?
Building a custom anomaly detection framework requires significant ongoing engineering resources to manage statistical models, maintain metadata connectors, and update visual lineage interfaces. Commercial observability tools offer pre-built connectors, mature ML engines, and enterprise support out of the box.
Conclusion
Data reliability is no longer an optional luxury—it is a critical requirement for modern, data-driven enterprises. Relying on manual threshold assertions and reactive failure logging leaves organizations vulnerable to silent data outages, corrupted reporting, and damaged stakeholder trust. Predictive alert tools represent a major leap forward in DataOps and enterprise data observability. By leveraging machine learning models, statistical profiling, and automated lineage mapping, these platforms enable data engineering teams to catch pipeline anomalies before they affect business operations. Integrating predictive monitoring into your ELT pipelines, cloud data platforms, and analytics stacks builds a resilient, proactive, and self-healing data ecosystem.
