Introduction
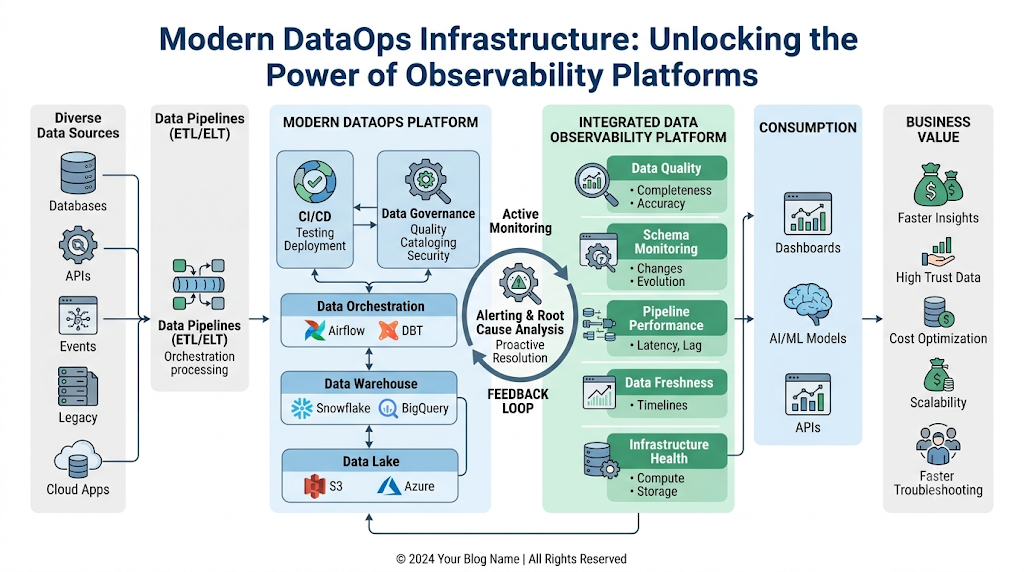
Modern enterprise data architectures are growing increasingly complex. Today, an ordinary business analytics pipeline might ingest streaming IoT logs, batch-load transactional customer databases, transform those layers via cloud data warehouses, and feed live machine learning models simultaneously. Because data pipelines are more complex than ever, data teams can no longer afford to operate in the dark. They require deep, granular visibility into pipeline performance, infrastructure health, and underlying data quality. To help teams master these complex frameworks, TheDataOps.org serves as a premier educational learning resource. Our goal is to translate abstract data engineering concepts into practical strategies for developers, architects, and engineering leaders worldwide. In this educational guide to Understanding Observability Platforms in DataOps, you will learn how modern observability frameworks operate. We will break down their core components, contrast them with legacy monitoring tools, explore leading open-source and enterprise platforms, and provide actionable blueprints for building reliable, self-healing data ecosystems.
What Is Observability in DataOps?
Definition
In software engineering, observability is the measure of how well you can understand the internal states of a system based solely on its external outputs. Applied directly to data engineering, Understanding Observability Platforms in DataOps means having the tools and processes to continuously infer the health, quality, and performance of an enterprise data ecosystem across its entire lifecycle—from raw source ingestion to final business consumption.
Core Objectives
DataOps observability focuses on three main objectives:
- Reliability: Guaranteeing that data pipelines execute successfully and predictably within expected timeframes.
- Trust: Ensuring the data moving through those pipelines is accurate, complete, and formatted correctly.
- Efficiency: Optimizing cloud infrastructure spend, query runtimes, and engineering resources.
Difference Between Monitoring and Observability
While people often use the terms interchangeably, monitoring and observability are distinct practices. Monitoring is a passive practice that tracks predetermined, known metrics—such as checking if a server’s CPU usage crosses 90% or if an Airflow DAG completed successfully. It tells you what happened based on rules you already wrote.
Observability is an active, investigative practice. It gathers deep system telemetry to help you answer unexpected questions about why a system is behaving abnormally. Monitoring says, “The ingestion pipeline failed.” Observability says, “The ingestion pipeline failed because an upstream CRM update changed a phone number field from an integer to a string, which caused your Spark cluster to run out of memory.”
Importance for Enterprise Data Operations
For enterprise organizations, data is a mission-critical software product. When data operations lack observability, engineers spend up to 80% of their week playing detective—manually writing validation scripts, chasing down broken schemas, and responding to angry Slack messages from executives who noticed empty dashboards. Observability platforms automate this detective work, changing data engineering from a reactive firefighting loop into a disciplined, proactive operation.
Core Components of DataOps Observability
To achieve true system visibility, an observability platform relies on six foundational pillars.
       ┌─────────────────────────────────────────────────────────┐
       │               DataOps Observability Platform            │
       └────────────────────────────┬────────────────────────────┘
                                    │
         ┌──────────────────────────┼──────────────────────────┐
         ▼                          ▼                          ▼
     [Metrics]                   [Logs]                    [Traces]
 (Numerical Health)        (Textual History)         (End-to-End Path)
         │                          │                          │
         ┌──────────────────────────┼──────────────────────────┘
         ▼                          ▼                          ▼
  [Data Quality]            [Lineage Tracking]         [Smart Alerting]
(Validation/Freshness)     (Upstream/Downstream)      (Context/Routing)
Metrics
Metrics are numerical values measured over intervals of time. They offer a high-level view of your system’s operational health. Key DataOps metrics include database connections, read/write IOPS, cluster memory consumption, data pipeline run duration, and daily row ingestion counts.
Logs
Logs are timestamped text records generated by applications, databases, and orchestration engines when specific events occur. A log file provides an explicit history of what your systems did at an exact microsecond. Examples include Snowflake query history logs, AWS Glue execution prints, and dbt compilation outputs.
Traces
Traces map the end-to-end journey of a single transactional request or data record as it moves across various microservices, networks, and storage tiers. In a data pipeline, a trace helps you see exactly how long a specific dataset spent inside an ingestion engine, a staging area, a transformation layer, and a BI visualization tool.
Data Quality Monitoring
Data quality monitoring analyzes the actual data records passing through your pipelines rather than just checking the underlying infrastructure. It automatically checks your tables for missing values (null counts), unexpected schema mutations, duplicate rows, and value distributions that deviate from statistical norms.
Lineage Tracking
Data lineage is a visual map showing how data flows, transforms, and changes over time across your organization. It connects upstream data sources (like an ERP platform) directly to downstream targets (like an executive Looker dashboard). If a specific column changes in your data warehouse, lineage tells you exactly which dashboards and machine learning models will be affected.
Alerting and Notifications
Raw data is useless if engineers must manually watch a dashboard all day. Modern observability platforms include intelligent alerting engines. These systems group related events, filter out normal system background noise, and route actionable incident alerts directly to teams via Slack, Microsoft Teams, or PagerDuty.
Understanding Observability Platforms in DataOps
Let us look at how enterprise data teams use these core components to solve day-to-day data engineering challenges.
Monitoring Data Pipelines
Imagine an e-commerce company running an orchestration pipeline that aggregates millions of global sales transactions every midnight. An observability platform keeps a close eye on this process, continuously graphing how long the pipeline takes to complete and highlighting any sudden performance drops.
Detecting Pipeline Failures
If an overnight extraction script crashes because a cloud storage bucket permissions policy changed, the observability platform catches the exception immediately. It captures the exact error trace and flags the failed step in the orchestration UI so engineers don’t have to guess where the break happened.
Tracking Data Freshness
Data freshness ensures your business operations rely on current information. For example, if a financial company expects a risk assessment table to update every hour, the observability system tracks the maximum age of the data (also known as data SLA or data slack). If no new records arrive for 90 minutes, it flags a data freshness anomaly.
Measuring Data Quality
Suppose a marketing pipeline accidentally ingests an analytics file where a tracking bug replaced 40% of user IDs with blank spaces. A traditional infrastructure monitor would mark the pipeline as “Successful” because the server stayed online. However, a DataOps observability tool inspects the actual data payload, flags the sudden spike in null values, and halts the pipeline before that corrupted data pollutes downstream production tables.
Root Cause Analysis
When an engineering team is alerted that an operational executive dashboard is displaying incorrect revenue numbers, they use the observability platform to trace the problem backward. By viewing the visual data lineage map, they quickly find that a transformation step inside their data warehouse failed three steps upstream, which caused the dashboard to read stale, unaggregated cache data.
Performance Optimization
Observability platforms help engineers spot slow, costly bottlenecks. For instance, by analyzing query execution traces, a platform engineer can quickly identify a collection of unindexed, poorly written SQL queries inside a dbt model that are driving up Snowflake warehouse compute credits by 200%.
Capacity Planning
As enterprise data footprints expand, platform teams must anticipate hardware constraints. Observability systems analyze historical storage growth and processing trends over months, giving engineers the predictive insight needed to scale out Kubernetes worker nodes or adjust cloud budget allocations well ahead of time.
TheDataOps.org Guide to DataOps Observability Platforms
Building a resilient data ecosystem requires a systematic approach. Here is how we break down the implementation journey at TheDataOps.org to help teams move from chaotic troubleshooting to structured, automated operations.
Building Reliable Data Pipelines
Reliability begins by making your pipelines observable by design. Instead of treating telemetry as an afterthought, engineers should embed logging hooks, validation assertions, and trace spans directly into their code from day one. This ensures that every deployed pipeline automatically broadcasts its status to your central observability hub.
Improving Operational Visibility
Centralization is key to visibility. A fragmented data stack where data engineers use one tool, DevOps uses another, and analysts use a third creates operational blind spots. Your observability platform should pull metrics, lineage, and error logs from every tool in your stack into a single dashboard view.
[ Sources: APIs / DBs ] ──► Ingestion Telemetry
                                  │
[ Processing: Spark / dbt ] ──► Transformation Logs  ──► [ Central Observability Platform ]
                                  │
[ Storage: Lakehouses ]     ──► Storage Metrics
Reducing Pipeline Downtime
When an incident occurs, the priority is minimizing the impact on downstream systems. By utilizing automated lineage maps, engineers can immediately isolate a failing component, route notifications to the affected teams, and swap in healthy fallback data sources to keep core business operations running.
Enhancing Data Quality
High-quality data requires automated safeguards. We advocate for a hybrid validation approach: combining explicit, code-defined assertions (like checking that a primary key is never null) with machine-learning-driven threshold monitoring that adapts to your data’s natural daily and weekly volume patterns.
Scaling Enterprise Data Platforms
As your data team grows from 5 engineers to 50, manual system upkeep becomes impossible. Observability platforms allow teams to manage data reliability at scale by treating “Data Quality as Code.” Teams can define clear service level objectives (SLOs) using configuration files that deploy automatically alongside their main infrastructure code.
Popular Observability Platforms
DataOps teams use a mix of open-source frameworks and enterprise platforms to maintain visibility across their systems.
OpenTelemetry
OpenTelemetry is a vendor-neutral, open-source collection of tools, APIs, and SDKs used to instrument, generate, and export telemetry data (metrics, logs, and traces). It acts as a standardized data collection layer, ensuring your engineering teams don’t get locked into a single commercial monitoring tool.
Prometheus
Prometheus is an open-source, time-series monitoring and alerting toolkit optimized for containerized environments like Kubernetes. It is widely used in DataOps to scrape and store real-time performance metrics from distributed data processing clusters, such as Apache Spark or Presto query engines.
Grafana
Grafana is an open-source data visualization and dashboarding platform. It connects directly to time-series databases like Prometheus, allowing DataOps teams to build beautiful, real-time dashboards that track cluster utilization, pipeline runtimes, and system error rates in one clear view.
Datadog
Datadog is a comprehensive, commercial cloud-scale monitoring and observability platform. It offers specialized data pipeline monitoring integrations that trace data assets all the way from orchestration tools like Apache Airflow down to deep cloud data warehouse query layers.
Splunk
Splunk is an enterprise-grade log analytics and observability platform designed to ingest, search, and analyze massive volumes of machine-generated log data. It excels at parsing unstructured system logs, making it a popular choice for securing and troubleshooting large-scale enterprise data operations.
Elastic Observability
Built on the Elasticsearch ELK stack, Elastic Observability combines log monitoring, infrastructure metrics, and application performance monitoring (APM) into a single unified search engine. Data teams use it to index and analyze query patterns, access audits, and pipeline execution logs at scale.
Benefits of Observability Platforms
Adopting a dedicated observability platform offers clear structural advantages for growing data teams.
- Improved Pipeline Reliability: Pipelines execute predictably because potential bottlenecks, resource deadlocks, and silent logic failures are flagged and resolved early.
- Faster Issue Detection: Teams drastically cut down their Mean Time to Detect (MTTD). Instead of waiting for business users to find a data error hours later, engineers are alerted within seconds of a failure.
- Better Data Quality: Automated validation checks stop corrupted or missing values from traveling down the line, ensuring downstream analytics tools remain accurate and trustworthy.
- Enhanced Operational Efficiency: Automated root cause analysis frees data engineers from manual debugging loops, allowing them to spend their time building new features rather than fixing old ones.
- Reduced Downtime: Quick issue isolation and smart alert routing allow teams to patch broken data pipelines before they cause systemic business disruptions.
- Easier Scalability: Centralized monitoring, standardized telemetry formats, and policy-driven alerting let a lean platform team easily manage thousands of production data pipelines.
Traditional Monitoring vs DataOps Observability
| Feature | Traditional Monitoring | DataOps Observability |
| Visibility | Limited to individual infrastructure components | End-to-end lineage across the full lifecycle |
| Root Cause Analysis | Manual, requiring log digging across multiple tools | Faster, data-driven, and assisted by lineage maps |
| Data Quality Tracking | Limited to basic server status and file checks | Continuous, checking actual data profiles and trends |
| Alerting | Threshold-based (e.g., CPU > 90%), prone to noise | Context-aware, utilizing anomaly detection thresholds |
| Scalability | Moderate; struggles with modern decoupled data stacks | High; built natively for distributed cloud data ecosystems |
Common Challenges
Transitioning to an production-grade observability model comes with several clear implementation challenges.
Tool Integration
Modern data architectures use a wide mix of legacy databases, cloud warehouses, open-source orchestration tools, and modern ingestion tools. Getting all these mismatched systems to speak a single telemetry language can be tough. Recommendation: Adopt open standards like OpenTelemetry to create a unified data collection layer across your entire stack.
Large Data Volumes
Ingesting, processing, and storing log files, execution traces, and metric streams for petabyte-scale data pipelines can quickly become expensive. Recommendation: Apply smart data retention rules. Keep granular execution traces for a few weeks, while rolling up high-level operational metrics for long-term trend analysis.
Alert Fatigue
If an observability platform sends thousands of low-priority alerts to a team’s Slack channel every day, engineers will start ignoring them. This raises the risk that a critical system failure gets missed. Recommendation: Design context-aware alerts. Only trigger urgent notifications for issues that breach your core data SLAs or directly impact critical downstream tables.
Legacy Systems
Older on-premises enterprise data lakes and legacy mainframes often lack native APIs or logging hooks, making it difficult to extract real-time telemetry. Recommendation: Deploy lightweight log-forwarding agents or create custom wrapper scripts that capture execution metadata and push it to your modern observability hub.
Skills Gap
Modern DataOps observability requires a blend of traditional data engineering, DevOps infrastructure management, and statistical analysis skills, which can be difficult to find in a single team. Recommendation: Use intuitive, low-code observability platforms, and leverage educational resources like TheDataOps.org to level up your team’s skills step by step.
Best Practices
To maximize your investment in an observability platform, keep these five implementation strategies in mind:
- Monitor data quality continuously: Run automated assertions and statistical profiling checks at every major step of your pipeline—during ingestion, after transformation, and before final delivery.
- Track pipeline lineage: Build and maintain an accurate, end-to-end visual lineage map to understand how your data assets depend on one another.
- Standardize observability metrics: Establish consistent naming conventions, log formats, and performance tags across all your engineering teams.
- Automate alerts and notifications: Move away from manual checklist reviews. Set up automated anomaly routing to send the right alerts to the right teams instantly.
- Regularly review dashboards and reports: Set aside time every month to review performance trends, clean up old alerts, and optimize slow queries to keep your platform running efficiently.
Key Performance Metrics
A successful DataOps program relies on tracking clear, data-driven performance metrics:
- Pipeline Success Rate: The percentage of scheduled data pipeline executions that complete successfully without errors over a given timeframe.
- Data Freshness: The time elapsed since your data tables were last updated with the newest source records.
- Mean Time to Detect (MTTD): The average amount of time it takes for your data team to discover a pipeline incident or data quality failure after it occurs.
- Mean Time to Recovery (MTTR): The average time it takes for your team to fix a broken pipeline, repair data, and restore normal production operations.
- Data Quality Score: The percentage of ingested data records that pass all your automated quality validations, schema checks, and business logic tests.
- Pipeline Latency: The total time it takes for a data point to travel from its initial creation in a source system to its final destination in your warehouse or data lake.
Career Opportunities
Developing a deep mastery of DataOps observability opening doors to pioneering roles across modern data teams:
- DataOps Engineer: Designing, automating, and maintaining the deployment pipelines, infrastructure, and observability tools for data teams.
- Data Engineer: Building production data pipelines while implementing embedded logging, tracing, and validation frameworks.
- Observability Engineer: Specializing in setting up enterprise monitoring architecture, log management platforms, and distributed tracing platforms.
- Platform Engineer: Managing the underlying cloud environments, orchestration tools, and Kubernetes clusters that run data processing jobs.
- Cloud Data Engineer: Migrating, optimizing, and securing scalable data architectures within native enterprise cloud environments.
- Analytics Infrastructure Specialist: Bridging the gap between data engineering and business intelligence by ensuring transformation layers and visualization tools are fast and reliable.
Future of DataOps Observability
The future of data management is moving toward highly automated, resilient ecosystems.
AI-Assisted Observability
Observability platforms are increasingly using machine learning models to analyze log messages and trace patterns, allowing them to automatically surface system anomalies without requiring any manual configuration.
Predictive Pipeline Monitoring
Instead of waiting for a pipeline to fail, future systems will analyze real-world factors like upstream data volumes and cloud system loads to predict performance bottlenecks and failures before they happen.
Autonomous Data Operations
We are moving toward systems that can manage themselves. If a processing node runs out of memory or a database connection drops, the orchestration layer will automatically restart the job, adjust resource limits, and fix the issue without needing an engineer to log in.
Intelligent Alerting
Future alerting tools will deeply understand system context. They will automatically suppress non-critical errors during routine maintenance windows and combine hundreds of scattered alerts into a single, cohesive incident timeline.
Self-Healing Data Pipelines
When a schema update breaks a pipeline step, a self-healing system can automatically catch the change, safely quarantine the modified records to an isolated table, update downstream mappings, and keep the rest of the pipeline running smoothly.
Common Misconceptions
Let us clarify a few common myths surrounding data observability platforms.
Monitoring and Observability Are the Same
Monitoring tracks known, explicit failures based on predefined thresholds. Observability provides the rich, deep context and system-wide visibility needed to dig into unexpected behavior and explain why a complex, multi-layered system failed.
Observability Is Only for Large Enterprises
While large organizations run more pipelines, small teams actually benefit immensely from observability. With fewer engineers on hand, automated monitoring, alerting, and root cause analysis help small teams keep up with massive workloads without burning out.
Dashboards Alone Provide Full Visibility
A common mistake is assuming that a clean Grafana dashboard means your systems are fully observable. A dashboard is simply a visual display. True observability requires a reliable backend system that actively collects, correlates, and analyzes metrics, logs, and traces across your entire stack.
Observability Eliminates the Need for Human Analysis
Observability platforms automate data collection, flag anomalies, and point you directly toward root causes. However, resolving complex logic bugs, writing custom business validation rules, and designing system architecture changes still require human engineering expertise.
FAQ Section
- What is a data observability platform?
A data observability platform is an integrated software system that connects to your entire data stack to continuously monitor pipeline performance, track data lineage, and evaluate data quality.
- How does observability differ from traditional data testing?
Data testing runs static checks on your data at a specific point in time, usually before it goes live. Observability provides continuous, real-time tracking of your data and infrastructure health across the entire operational lifecycle.
- What is data lineage and why is it important?
Data lineage is a visual map that tracks the lifecycle, movement, and transformation of data over time. It is crucial for conducting quick root cause analysis and understanding how changes impact downstream systems.
- What is alert fatigue in DataOps?
Alert fatigue happens when engineers are bombarded by too many low-priority, non-actionable notifications. Over time, this causes teams to tune out alerts, increasing the risk that a major system failure gets ignored.
- Can open-source tools be used to build a DataOps observability platform?
Yes. Many engineering teams build powerful, budget-friendly observability setups by combining open-source tools like OpenTelemetry for data collection, Prometheus for metrics storage, and Grafana for dashboards.
- What is the meaning of data freshness?
Data freshness measures how current your data is relative to real-world events. It tracks the time elapsed since a data asset was last updated with new information.
- How does an observability platform help save cloud compute costs?
It highlights slow, poorly optimized queries, redundant data processing jobs, and underutilized storage layers, giving engineers the insights they need to optimize resources and lower cloud spend.
- What is the No-Cloning Theorem and does it apply to DataOps?
The No-Cloning Theorem is a principle of quantum physics stating you cannot copy a quantum state. It does not apply to DataOps, where classical data can and should be safely duplicated, backed up, and version-controlled.
- What does MTTD and MTTR stand for?
MTTD stands for Mean Time to Detect (how fast you find a problem), and MTTR stands for Mean Time to Recovery (how fast you fix it).
- Where can I learn more about setting up DataOps infrastructure?
You can access detailed architectural guides, frameworks, and educational deep-dives directly at TheDataOps.org to level up your pipeline operations.
Final Summary
In the modern enterprise landscape, data pipelines are the foundational highways that power business intelligence, AI initiatives, and operational decision-making. As these data pipelines become more distributed and complex, traditional monitoring solutions are no longer sufficient to guarantee reliability and performance. Implementing and Understanding Observability Platforms in DataOps has shifted from a luxury approach to an operational necessity. By building on the core pillars of metrics, logs, traces, data quality profiling, and automated lineage tracking, observability platforms provide data teams with complete, end-to-end visibility. This clear viewpoint allows engineers to shift away from reactive firefighting, helping them find performance bottlenecks, catch schema drift, and validate data health before a single bad record reaches production dashboards.
