Introduction
Traditional monitoring systems are no longer equipped to handle this level of complexity. Legacy tools depend entirely on static thresholds, which flag problems only after a data pipeline breaks or silent data corruption spreads into production databases. This reactive approach leaves data engineers constantly firefighting issues, which delays downstream business analytics, disrupts customer-facing software, and costs enterprises millions in lost operational productivity. By adopting a disciplined, data-focused approach to operations, organizations can eliminate blind spots across their data processing stacks. Leveraging specialized educational resources like TheDataOps.org enables platform engineers and data architects to implement intelligent, automated frameworks that secure their data delivery chains. This guide breaks down how predictive monitoring platforms operate, explores their core components, and shows how they transform modern enterprise operations.
Core Highlights: Key Takeaways
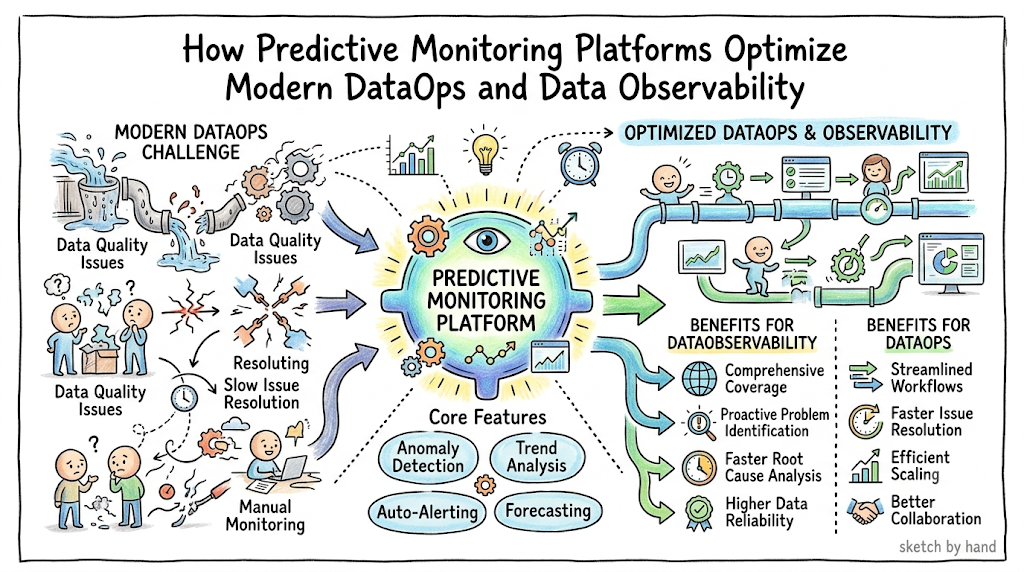
- Proactive Strategy: Predictive monitoring platforms move data operations away from reactive troubleshooting by catching pipeline failures before they impact downstream business dashboards.
- Algorithmic Baseline Control: Machine learning engines replace rigid static thresholds with dynamic performance baselines that adapt effortlessly to changing traffic workloads and seasonal trends.
- Data Health Enforcement: Bringing automated tracking tools into the collection cycle ensures high data observability, stopping bad data from entering target storage units.
- Lower Maintenance Costs: Identifying pipeline blockages early reduces manual debugging hours, prevents expensive re-computations, and protects enterprise SLAs.
What Are Predictive Monitoring Platforms?
Predictive monitoring platforms are advanced, machine-learning-driven software suites designed to continuously ingest, evaluate, and interpret telemetry data across an enterprise software stack to forecast future operational states and potential failure points. Unlike traditional diagnostic utilities that merely record historical data points, these platforms actively project future system behaviors by tracking subtle changes across system variables.
The core differentiator between legacy approaches and predictive monitoring platforms lies in the shift from reactive tracking to proactive forecasting. A reactive system acts like a smoke alarm, alerting engineers only after a data pipeline has crashed or an ETL script has failed. In contrast, a predictive platform runs time-series forecasting models to spot early infrastructure drift—such as a gradual memory leak or a slow drop in database throughput—warning teams hours before an actual crash happens.
Reactive Monitoring:  [System Failure] ──> [Alert Dispatched] ──> Manual Firefighting
Predictive Monitoring: [Subtle Drift] ──> [AI Predicts Failure] ──> Proactive Prevention
Within modern data operations, these intelligent platforms act as a continuous automated validation engine for enterprise pipelines. They analyze historical trend data to learn normal performance boundaries for every processing step, including row counts, ingestion speeds, and data schema rules. This deep analytical foundation allows organizations to run reliable, automated data delivery chains that keep pace with fast-changing business demands.
Why Predictive Monitoring Matters in DataOps
Data pipeline failures represent a significant threat to modern enterprise performance, often causing massive disruptions to downstream operations. When a complex ETL processing job fails silently halfway through its run due to a minor schema change or a database connection timeout, identifying the exact failure point requires hours of manual log inspection. Without predictive systems, these issues often go unnoticed until business teams spot broken metrics on their primary dashboards.
System latencies and processing bottlenecks present another persistent problem for traditional operations teams. As incoming data volumes surge during peak traffic periods, data lakes and streaming components can suffer severe resource limits. Predictive monitoring platforms manage these demands by analyzing historical ingestion patterns to predict upcoming processing slowdowns, allowing platforms to scale up computing power ahead of time.
Data Surges ──> [Predictive Platform Identifies Limit] ──> Auto-Scale Compute ──> No Latency
Data quality risks also threaten the integrity of modern analytics environments. Even if a data pipeline completes its run on time without any technical errors, the underlying data may contain malformed values, missing fields, or duplicate entries. Advanced predictive analytics tools address this by verifying data profiles in real time, blocking corrupted information from polluting enterprise data warehouses.
The business impact of data platform downtime can be devastating. When critical reporting engines go offline, executives lose the real-time insights required to make time-sensitive operational choices. For industries like e-commerce, banking, and healthcare, a single hour of data corruption can lead to immediate compliance penalties, lost customer transactions, and long-term damage to brand reputation.
How Predictive Monitoring Works
The process begins with continuous, high-volume data ingestion from all layers of the enterprise data ecosystem. Predictive monitoring platforms connect directly to infrastructure components using secure APIs and streaming webhooks to capture system logs, performance metrics, database events, and pipeline execution records. This wide collection model builds a detailed foundation for deep behavioral analysis.
Once the raw telemetry data is gathered, the platform applies advanced historical pattern analysis. The machine learning models analyze weeks of historical data to map out standard system cycles, identifying regular variations like daily traffic dips, weekly maintenance jobs, and seasonal data surges. This training phase allows the software to establish dynamic performance boundaries that adjust naturally as workloads shift.
Telemetry Streams ──> [Historical Pattern Analysis] ──> Dynamic Performance Baselines
These dynamic baselines feed directly into specialized machine learning forecasting models. The platform uses advanced time-series analysis and regression models to continuously project system trends into the future. For example, if disk space consumption begins climbing at a faster rate than normal on a primary storage node, the algorithm calculates the exact time when the system will run out of space.
Ultimately, this predictive intelligence enables early anomaly prediction before failures can affect production environments. When the software catches a performance metric drifting toward an operational boundary, it flags the issue immediately. This gives data engineers an early warning window to fix the underlying infrastructure, transform data schemas, or clear database bottlenecks before a major crash can occur.
Core Components of Predictive Monitoring Platforms
Data Collection Layer
The foundation of a predictive monitoring platform is its data collection layer, which uses open standards like OpenTelemetry to securely harvest data from across the enterprise stack. This layer gathers system metrics, application logs, and database event records from every active pipeline component without creating performance drag on production workloads.
Streaming Analytics Engine
Once collected, telemetry data flows into a high-throughput streaming analytics engine designed to process millions of incoming events per second in real time. This component organizes incoming data streams, standardizes varying log formats, and adds descriptive tags to data fields so they can be immediately read by the machine learning tools.
AI/ML Prediction Models
The heart of the platform consists of an advanced AI/ML prediction engine that hosts a variety of specialized data models. This layer runs time-series forecasting to track system capacity trends, uses clustering algorithms to group related system anomalies together, and applies classification models to match current infrastructure behaviors against historical incident patterns.
Alerting and Notification Systems
When the prediction engine identifies a future system failure risk, it passes that insight to the alerting and notification system. Instead of flooding engineering text channels with repetitive warnings, this layer creates single, context-rich alerts that explain the predicted issue, detail the estimated time until failure, and route the ticket to the correct engineering squad.
Visualization Dashboards
The top of the architecture features interactive visualization dashboards that present system health data clearly to engineers and architects. These portals display live data lineage maps, show projected resource consumption lines, track active data quality scores, and summarize automated platform fixes in a single interface.
DataOps Perspective on Predictive Monitoring
From a DataOps perspective, predictive monitoring platforms are not just independent diagnostic tools; they are essential components woven directly into production data pipelines. This approach treats data pipelines as automated software products that require continuous testing, quality controls, and real-time performance validation at every step of their execution.
Integrating predictive monitoring directly into CI/CD for data pipelines helps development teams validate infrastructure updates before code hits production. When an engineer deploys an updated data transformation script, the predictive platform automatically monitors its initial runs. It compares the new performance signature with historical baselines to verify that the update will not create resource leaks or processing bottlenecks.
Deploy Update ──> [Predictive Performance Analysis] ──> Baseline Verification ──> Production Release
Additionally, this strategy enforces the continuous validation of data health as information flows through the enterprise network. The platform acts as an automated quality checkpoint, checking data profiles at key ingestion stages to catch schema anomalies or missing fields early. This prevents corrupted data from traveling down the pipeline, keeping your data warehouses completely clean.
Finally, predictive monitoring platforms establish automated feedback loops that drive continuous system improvement. When the platform catches an operational bottleneck or predicts a pipeline failure, it logs the incident data back into your development repositories. This gives engineering teams the clear data insights they need to refine code performance, update resource limits, and continuously harden system architecture.
Predictive vs Traditional Monitoring
| Operational Feature | Traditional Monitoring Systems | Predictive Monitoring Platforms |
| Alerting Approach | Reactive; fires alerts after a system failure or crash occurs. | Proactive; forecasts infrastructure anomalies before they happen. |
| Threshold Logic | Human-configured static limits that cause false alerts. | Machine-learning-driven dynamic boundaries that adjust to workloads. |
| Troubleshooting Workflow | Manual log checking and long team debugging sessions. | Automated root cause analysis with clear resolution suggestions. |
| Data Health Tracking | Limited to checking basic infrastructure uptime metrics. | Complete data observability covering data volume, quality, and lineage. |
| Capacity Management | Retroactive auditing after a resource limit is hit. | Time-series forecasting that predicts resource needs days in advance. |
| Operational Impact | Extended downtime while engineers search for the bug. | Rapid, preemptive maintenance that completely avoids outages. |
Predictive Monitoring Workflow in DataOps
[Data Ingestion] ──> [Normalization] ──> [Feature Extraction] ──> [Model Training]
                                                                        │
[Automated Response] <── [Alert Generation] <── [Anomaly Prediction] <──┘
Step 1: Automated Data Ingestion
The workflow begins with continuous, automated data ingestion from every layer of your data landscape. The collection layer harvests performance logs, execution durations, database events, and cloud resource metrics across all active processing environments, feeding a steady stream of system indicators into the analytics platform.
Step 2: Telemetry Data Normalization
As raw metrics arrive, the platform standardizes the data streams. The system normalizes varying terminology formats, cleans up broken log fields, and matches timestamps across different cloud regions and time zones, providing a reliable, structured data foundation for the machine learning models.
Step 3: Statistical Feature Extraction
The normalized data is processed through feature extraction pipelines to isolate key performance indicators. The platform filters out background noise and concentrates on critical metrics like pipeline execution speeds, row processing counts, memory growth trends, and database connection pools.
Step 4: Real-Time Model Training
The extracted features feed into machine learning models that are continuously updated with real-time operational data. This ongoing training cycle allows the software to adjust its baseline understanding of normal system performance as company data volumes and development cycles grow over time.
Step 5: Proactive Anomaly Prediction
The updated models evaluate live data flows to project future system performance trends. When the algorithm catches an operational metric drifting away from its historical baseline—such as an unusual rise in pipeline processing latency—it flags the trend as a future system failure risk.
Step 6: Context-Rich Alert Generation
Once a failure risk is identified, the system creates a detailed, context-rich alert ticket. Instead of sending a vague warning, the platform bundles together diagnostic log data, points out the specific component at risk, outlines the predicted business impact, and assigns the ticket to the right engineering team.
Step 7: Automated Response Execution
In advanced setups, the alert triggers an automated response script through integrations with orchestration tools and infrastructure-as-code utilities. The platform can spin up backup storage nodes, isolate corrupted data batches, or restart hung services independently, resolving the issue without needing manual work.
Key Use Cases
Data Pipeline Failure Prediction
In large enterprise environments, a single malformed data record can halt a complex, multi-stage processing pipeline, delaying downstream business reports for hours. Traditional tracking systems only notice the issue after the pipeline completely stalls. A predictive monitoring platform manages this by scanning data profiles at ingestion, flagging unusual schema variations early, and isolating the bad records in a separate folder so the rest of the pipeline can continue running smoothly.
Cloud Infrastructure Monitoring
Modern analytics architectures spin up hundreds of temporary cloud computing instances every day to handle massive processing workloads. If a cloud server runs out of memory during a heavy run, it can crash the entire job and corrupt your target tables. A predictive monitoring platform constantly tracks resource utilization trends, spots approaching memory limits ahead of time, and automatically expands compute allocations to ensure the job finishes without error.
ETL Job Health Prediction
Enterprise Extract, Transform, Load (ETL) routines often run for hours during quiet overnight windows. If a database lock or network timeout slows down an early step, the entire routine can spill over into the next business day, dragging down application speeds for employees and customers. Predictive analytics tools monitor overnight workflows in real time, notice early processing delays instantly, and alter scheduling priorities to guarantee that all business dashboards are updated before the office opens.
Streaming Data Anomaly Detection
Financial industries use real-time streaming pipelines to process millions of live transactions and catch fraud instantly. Traditional monitoring tools cannot analyze data at this speed, leaving systems vulnerable to subtle data drops or tracking lag. A predictive platform tracks streaming performance parameters second by second, notices any minor drop in transaction processing speeds, and isolates the bottleneck immediately to keep fraud detection active.
Business Intelligence System Reliability
Corporate executives rely heavily on automated Business Intelligence (BI) platforms to review daily sales data and make critical operational decisions. If an underlying data sync fails, these dashboards display stale or incorrect metrics, leading to misinformed choices. Predictive platforms monitor the entire data delivery chain feeding your BI portals, verify data completeness before dashboards refresh, and warn engineers if an upstream error threatens report accuracy.
Benefits of Predictive Monitoring Platforms
The most immediate benefit of deploying a predictive monitoring platform is a massive reduction in system downtime. By identifying system drifts and forecasting infrastructure failures hours before they turn into actual outages, companies can transition away from stressful firefighting mode. This proactive approach ensures that data platforms remain highly available to support daily business applications.
Furthermore, these platforms accelerate issue prevention across your entire data landscape. Instead of forcing data engineers to spend valuable development hours manually digging through raw system logs after a crash, the platform serves up clear root cause analysis alongside the alert. This allows teams to apply targeted infrastructure or code fixes quickly, saving time and energy.
AI Root Cause Insights ──> Targeted Preemptive Fixes ──> Zero Production Outages
Predictive platforms also drive measurable improvements in overall data reliability. By validating data quality and checking schemas continuously at every stage of ingestion, the system stops corrupted or incomplete records from reaching production data warehouses. This ensures that downstream data analysts and machine learning models are always working with pristine, dependable data.
Additionally, adopting predictive analytics tools lowers operational costs across enterprise engineering departments. Teams save money by avoiding expensive cloud re-computations that happen when long-running ETL jobs fail halfway through their schedule. This optimization allows companies to streamline their cloud resource usage and maximize the value of their existing data engineering talent.
Finally, high-fidelity tracking supports better executive decision-making across the enterprise. When senior leaders know that the data feeding their corporate dashboards is continuously audited and verified by advanced AI monitoring tools, they can trust their operational metrics implicitly. This allows the business to act on automated insights quickly and move ahead of competitors with absolute confidence.
Challenges in Predictive Monitoring
A foundational challenge when implementing predictive monitoring platforms is managing poor data quality within your core telemetry streams. Machine learning algorithms depend entirely on consistent, high-fidelity log and metric inputs to establish reliable performance baselines. If your existing databases, servers, and pipelines produce incomplete logs or erratic timestamp records, the prediction engine will struggle to build accurate models.
Model accuracy limitations also present a hurdle for teams during initial rollout phases. If the underlying machine learning algorithms are trained on too little historical data, they may struggle to differentiate between a normal traffic surge and a genuine system anomaly. Overcoming this requires data teams to allocate adequate time for model training across multiple business cycles before enabling automated fixes.
Incomplete Log History ──> Uncalibrated AI Models ──> High False Positive Volumes
Furthermore, processing high-volume telemetry data across thousands of enterprise pipelines creates a high computational cost. Running real-time streaming analytics and continuous time-series forecasting requires significant processing power and storage capacity. Organizations must plan their monitoring budgets carefully to ensure the running costs of the predictive platform do not outweigh its financial benefits.
At the same time, platforms must minimize false positives and false negatives to maintain developer trust. If an AI tool is tuned too aggressively, it will trigger unnecessary alerts for minor, harmless anomalies, leading to alert fatigue. Conversely, if it is too relaxed, it may miss genuine infrastructure failures. Finally, integration complexity can create delays, as connecting an advanced prediction tool to a mix of modern cloud databases and legacy data systems requires careful engineering.
Best Practices for Implementation
To maximize the return on your predictive monitoring platform investment, your first priority must be starting with clean and structured data. Before enabling advanced machine learning models, ensure that all data pipelines, cloud databases, and application frameworks are configured to output clean logs using standardized formats like JSON. Standardizing your telemetry logs makes it easy for prediction algorithms to read data and map patterns accurately.
Next, adopt a hybrid monitoring approach that combines traditional rules with advanced AI capabilities. Do not throw away your standard threshold alerts entirely; instead, use simple rules for straightforward, black-and-white metrics—like a completely dead server—while using machine learning models for complex, shifting metrics like pipeline processing latency. This blended strategy keeps your alerting system highly dependable and easy to manage.
Static Rules (Dead Assets) + Machine Learning (Shifting Latency) = Dependable Monitoring
It is also vital to continuously retrain your machine learning models to keep pace with changing company workloads. As your enterprise expands, launches new product lines, or updates its data schemas, old performance baselines will become obsolete. Build automated schedules that retrain your monitoring algorithms on fresh operational data every week, ensuring your failure predictions stay accurate.
Additionally, design your platform to focus exclusively on actionable alerts. Configure your notification channels to only page an on-call engineer if the predicted anomaly requires a direct human response and threatens your business SLAs. Filtering out minor warnings protects your engineering team from alert fatigue and keeps everyone focused on high-priority tasks.
Finally, align your predictive monitoring insights closely with your existing DataOps workflows. Integrate your platform’s alert outputs directly with your enterprise ticketing systems, code repositories, and chat channels. Connecting these tools ensures that when a failure is predicted, the diagnostic data is instantly routed into your team’s daily development pipeline, driving fast fixes.
Future of Predictive Monitoring in DataOps
The future of data systems is moving rapidly toward fully autonomous data observability. We are quickly moving past the point where monitoring tools simply tell engineers that a pipeline might fail; next-generation systems will independently manage entire data landscapes from end to end. These intelligent platforms will continuously audit data health, map dependencies, and adjust system settings across global networks without needing human input.
This evolution will lead directly to the widespread adoption of self-healing pipelines within enterprise architectures. By combining predictive analytics with automated code orchestration frameworks, data networks will fix their own internal bugs in real time. If the platform predicts a pipeline failure due to an infrastructure slowdown, it will automatically spin up backup servers and move data workloads over seamlessly.
Anomaly Forecasted ──> [Autonomous AI Controller] ──> Self-Healing Pipeline Adjustment
We will also see advanced AI-driven forecasting systems that go beyond tracking basic hardware metrics to model complete business data behaviors. These next-generation tools will predict how changes in consumer traffic, product launches, or global events will affect your data processing infrastructure weeks in advance, allowing data teams to plan capacity with incredible accuracy.
Ultimately, large language models will become a standard tool inside modern data control rooms, acting as intelligent monitoring assistants. These specialized assistants will allow data architects and business analysts to query complex data systems using natural, everyday language. Teams can simply ask the assistant to summarize current pipeline health or explain a recent performance trend, making advanced data observability accessible to everyone across the company.
Key Takeaways
- Proactive Shift: Predictive monitoring platforms transform data operations by moving teams away from stressful, reactive firefighting and enabling early issue forecasting.
- Automation-Driven Quality: Integrating predictive monitoring into DataOps workflows provides continuous validation of data quality, keeping data warehouses clean.
- Machine Learning Baselines: Using AI to establish dynamic performance boundaries eliminates false alarms and ensures highly accurate anomaly detection.
- Autonomous Future: Next-generation data landscapes will rely on self-healing pipelines that automatically identify, analyze, and resolve operational risks.
FAQ Section
1.What is a predictive monitoring platform?
A predictive monitoring platform is an advanced data management platform that applies machine learning models to real-time system logs, infrastructure metrics, and data events to forecast future system states. It isolates structural patterns and performance drifts, allowing data teams to catch and fix pipeline bugs before they cause a production outage.
2.How does predictive monitoring work?
Predictive monitoring platforms operate by continuously ingesting telemetry data from across your data ecosystem. The platform’s machine learning engine analyzes weeks of historical data to build dynamic baselines of normal performance, runs time-series forecasting models to project future trends, and flags anomalies early so engineers can take preventative action.
3.What is the difference between reactive and predictive monitoring?
Reactive monitoring tools only alert engineers after a system failure, crash, or data corruption event has already disrupted production workloads. Predictive monitoring platforms use advanced forecasting models to analyze real-time performance trends and flag potential failure risks hours before an outage can happen.
4.Why is predictive monitoring important in DataOps?
Predictive monitoring is essential in DataOps because modern distributed data environments change too quickly for manual tracking. The platform ensures data reliability, reduces pipeline downtime, automates root cause analysis, and prevents bad or corrupted data from polluting corporate data lakes and dashboards.
5.What tools are used in predictive monitoring?
Predictive monitoring solutions combine open data collection standards like OpenTelemetry, streaming analytics processors, machine learning models for trend forecasting, automated notification engines, and interactive dashboards that display data lineage and health metrics clearly.
6.Can predictive monitoring prevent system failures?
Yes, predictive monitoring platforms are highly effective at preventing system failures by giving data teams an early warning window to fix issues. By highlighting approaching resource limits, data schema conflicts, or database locks early, the platform allows engineers to apply fixes before a major crash can occur.
7.How does AI help in monitoring systems?
AI transforms system monitoring by replacing human-configured static thresholds with adaptive, dynamic performance baselines. Machine learning algorithms analyze complex, multi-cloud data streams in real time, filter out repetitive alert noise, group related system anomalies together, and provide clear root cause insights during incidents.
8.What is anomaly prediction in DataOps?
Anomaly prediction in DataOps is the automated process of identifying unusual trends or unexpected behaviors within data pipelines before they lead to a system failure. The platform tracks indicators like unexpected drops in data volume, schema changes, or processing delays to catch bugs early.
9.Is predictive monitoring expensive to implement?
While setting up a predictive monitoring platform requires an initial investment in advanced software tools, computing resources, and team training, it saves companies significant money over the long term. The platform lowers operational costs by preventing expensive down-time, reducing manual debugging hours, and avoiding cloud re-computations.
10.How can beginners learn predictive monitoring?
Beginners can break into the field by studying data engineering foundations, mastering open collection frameworks like OpenTelemetry, and learning basic machine learning concepts. Reviewing practical architecture guides and educational resources on specialized platforms like TheDataOps.org provides an excellent path to mastering these core operational skills.
Conclusion
Successfully managing a modern enterprise data ecosystem requires moving past the limits of traditional, reactive monitoring workflows. As data networks expand across multi-cloud environments and streaming platforms, relying on old static threshold alerts leaves data engineering teams trapped in a cycle of constant firefighting. Waiting for a pipeline to crash or for corrupted data to reach your corporate dashboards disrupts business operations, delays critical reporting, and costs organizations significant time and money.
Implementing predictive monitoring platforms provides data teams with the centralized intelligence and automated power needed to secure their data delivery chains. By deploying advanced machine learning models to analyze telemetry streams, establish dynamic baselines, and forecast infrastructure risks, enterprises can identify and resolve anomalies with incredible speed. This shifts the organization away from stressful troubleshooting and establishes a highly dependable, proactive data operations framework.