Introduction
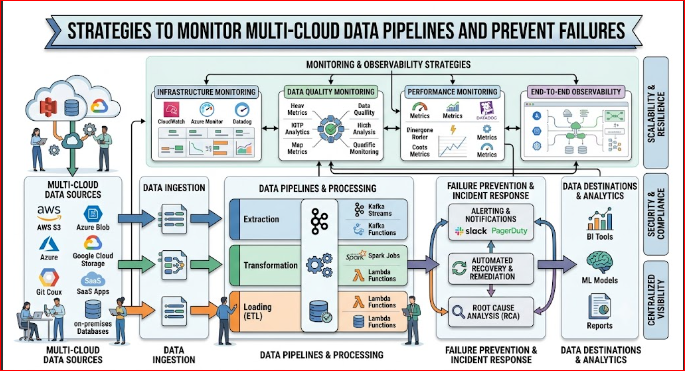
Today, data drives almost every major business decision. To keep up with massive amounts of information, organizations no longer rely on just one cloud provider. Instead, they increasingly use multiple cloud environments—such as Amazon Web Services (AWS), Microsoft Azure, and Google Cloud Platform (GCP)—to build their data systems. This strategy provides incredible flexibility, but it also introduces a major challenge: complexity. When your data flows across different clouds, keeping track of everything becomes difficult. A glitch in one cloud can break a report in another without anyone noticing until it is too late. This is why learning how to monitor multi-cloud data pipelines is essential. By tracking data as it moves through various environments, organizations ensure secure, timely, and highly reliable data delivery. In this guide, we will explore how modern DataOps practices make this complex task simple, clear, and manageable. For more insights on building resilient data infrastructure, visit TheDataOps.org.
What Are Multi-Cloud Data Pipelines?
Before diving into monitoring, let’s break down what these systems actually are.
Definition
A data pipeline is like a digital plumbing system. It moves data from a source (like an app or a database), changes it into a usable format, and delivers it to a destination (like a data warehouse or dashboard). A multi-cloud data pipeline does this exact job, but its parts are spread out across more than one cloud provider.
How Multi-Cloud Pipelines Work
Imagine a retail company that collects customer clicks on AWS. They might copy that data to Google Cloud to run advanced machine learning tools, and then send the final reports to Microsoft Azure for the finance team to view. The data travels across different networks, changing shapes along the way. Cloud-agnostic pipeline automation tools help orchestrate these steps, ensuring that work done in Cloud A triggers the next step smoothly in Cloud B.
Why Organizations Adopt Multi-Cloud Strategies
Companies do not use multiple clouds just to make things complicated. They do it for very specific strategic reasons:
- Avoiding Vendor Lock-In: Relying on one cloud provider gives that vendor complete control over your pricing. Using multiple clouds keeps your options open.
- Choosing the Best Tools: One cloud might have the best database, while another has the best artificial intelligence tools. A multi-cloud setup lets you use the best tool for each specific job.
- Cost Savings: Different clouds charge different rates for storage and computing. Companies can route data tasks to the cheapest cloud available at any given time.
- High Availability: If one cloud provider suffers a massive regional outage, parts of the business can keep running on another cloud.
Common Business Use Cases
- Global Operations: A company runs its European branch on Azure because of local regulations but uses AWS in the United States.
- Data Migration: Moving data gradually from an old cloud system to a new cloud system without shutting down daily operations.
- Mergers and Acquisitions: When two companies merge, they often have to connect two different cloud systems immediately.
What Is DataOps Monitoring?
In the past, data teams built pipelines and only checked them when something broke. This reactive approach does not work in modern cloud data engineering. Enter DataOps.
Definition
DataOps (Data Operations) is a collection of practices that brings speed, automated testing, and constant collaboration to data teams. DataOps monitoring means using automated systems to watch over your data pipelines every second of the day.
Continuous Monitoring
Continuous monitoring means your systems are always checking the health of the pipeline. Instead of running a test once a week, automated scripts run every time new data passes through, catching problems immediately.
Data Observability
While traditional monitoring tells you when something goes wrong, data observability tells you why it went wrong. It looks deep inside the system, gathering logs, traces, and metrics to give you a complete picture of your data health.
Pipeline Health vs. Data Quality Monitoring
It is crucial to understand that a pipeline can be healthy even if the data inside it is broken.
- Pipeline Health: Asks, “Is the pipeline running?” It checks if the servers are powered on and if the data jobs finished on time.
- Data Quality Monitoring: Asks, “Is the data correct?” It checks if columns are missing, if numbers are impossibly high, or if formatting is wrong.
The Relationship Between Monitoring and Observability
Think of monitoring like the check-engine light in your car. It turns on when there is a problem. Observability is the diagnostic computer the mechanic plugs in to tell you exactly which part of the engine is failing. You need both to maintain true data reliability.
Why Monitoring Multi-Cloud Pipelines Is Important
Without a proper strategy to monitor multi-cloud data pipelines, your business is flying blind. Here is why investing in unified monitoring pays off:
- End-to-End Visibility: You can see your data’s entire journey from the moment it is created on AWS to the moment it lands on an Azure dashboard.
- Faster Issue Detection: Instead of waiting for a business user to complain about a broken report, your DataOps team gets an automated alert the minute an error happens.
- Improved Data Quality: Bad data gets caught and quarantined before it mixes with clean data, protecting your analytics.
- Better Compliance: Data laws require businesses to know exactly where their data is stored and how it is processed. Monitoring provides a clear audit trail.
- Reduced Downtime: When errors are found and fixed quickly, your business systems stay up and running.
- Cost Optimization: Multi-cloud data movement can be expensive. Monitoring helps you see exactly where you are wasting money on cloud transfers.
- Better Business Decision-Making: When executives know the data is accurate and fresh, they can make major business moves with total confidence.
Key Components of Multi-Cloud Pipeline Monitoring
To build a complete multi-cloud monitoring system, your DataOps strategy must track several different areas:
Pipeline Execution Monitoring
This tracks whether data jobs start on time, run smoothly, and finish successfully across all your clouds.
Data Freshness Monitoring
Data loses value as it gets older. Freshness monitoring ensures that your data is updated according to your business needs—whether that is every minute, every hour, or once a day.
Data Quality Validation
This checks the actual content of the data. It ensures that numbers fall within expected ranges, required fields are not empty, and text formats match standard rules.
Schema Change Detection
A schema is the structural blueprint of your data (like the columns in a spreadsheet). If a software engineer changes a column name in an AWS database without telling the data team, the downstream pipeline on GCP will break. Schema detection warns you the moment a structure changes.
Metadata Tracking
Metadata is “data about data.” Tracking it helps you understand the size, creation date, and ownership of every dataset in your system.
Data Lineage
Data lineage creates a visual map showing the origin of your data and every change it went through across various clouds. If a number looks wrong on a final report, lineage helps you trace it back to the exact source.
Infrastructure Monitoring
This tracks the health of the actual cloud servers, virtual machines, and databases running your pipelines.
Alerting and Notifications
When a failure occurs, the monitoring system must instantly send an email, text, or Slack message to the correct engineer so they can fix it.
Performance Monitoring
This tracks how fast your pipelines run. If a process that usually takes ten minutes suddenly takes four hours, performance monitoring highlights the bottleneck.
Cost Monitoring
Moving data between different cloud providers (known as egress fees) can result in massive bills. Cost monitoring flags expensive data transfers before they break your budget.
Common Monitoring Metrics
To understand the health of your multi-cloud data pipelines, you need to track specific, measurable numbers. Here are the most critical metrics:
- Pipeline Success Rate: The percentage of data jobs that finish successfully out of the total jobs run. A high percentage means your system is stable.
- Processing Latency: The amount of time it takes for data to travel from the start of the pipeline to the end. Low latency means faster insights.
- Data Freshness: The time gap between the current moment and the timestamp of the newest data point available.
- Error Rate: How often errors occur during data processing. A sudden spike indicates a major issue.
- Failed Jobs: The exact count of broken pipeline steps. Tracking this helps teams identify recurring problem areas.
- Throughput: The volume of data processed by the pipeline over a specific timeframe (e.g., gigabytes per hour).
- Resource Utilization: The percentage of cloud CPU, memory, and storage being consumed. This helps you scale your infrastructure efficiently.
- SLA Compliance: Service Level Agreements (SLAs) are promises made to the business about data delivery times. This metric tracks how often you keep those promises.
- Incident Resolution Time: How long it takes for the DataOps team to fix a pipeline once an alert is triggered.
Best Practices for Monitoring Multi-Cloud Pipelines
Building a system to monitor multi-cloud data pipelines requires a structured, orderly approach. Follow these industry best practices:
- Centralized Dashboards: Do not jump between different cloud consoles. Bring all your monitoring metrics into a single, unified dashboard so you can view your entire data estate at once.
- Automated Alerts: Set up smart alert thresholds. If you get alerted for every minor detail, your team will experience alert fatigue and ignore important warnings.
- Unified Logging: Force all your cloud systems to write logs in the exact same format. This makes searching for errors across clouds much faster.
- Standardized Monitoring Policies: Apply the same rigorous data quality rules to AWS, Azure, and GCP alike.
- End-to-End Observability: Look at the entire context of your data, combining infrastructure stats with data quality checks.
- Automated Testing: Run data validation checks automatically at every stage of the pipeline, not just at the final step.
- Role-Based Access Control (RBAC): Ensure that only authorized engineers can change monitoring rules or view sensitive data logs.
- Continuous Optimization: Regularly review your metrics to find slow jobs, expensive cloud paths, or unused data pipelines that can be turned off.
Common Challenges
Monitoring data across multiple clouds is highly beneficial, but it comes with distinct challenges:
- Data Silos: Each cloud provider wants you to stay inside their ecosystem, making it naturally difficult to share monitoring data across platforms.
- Different Cloud Services: AWS, Azure, and GCP use different terms, technologies, and logging formats, requiring engineers to learn multiple systems.
- Monitoring Complexity: Managing security keys, networks, and software connections across three distinct environments is inherently complex.
- Data Movement Latency: Moving massive datasets across the internet between different clouds takes time, creating natural delays in your pipelines.
- Security and Compliance: Keeping data secure while transferring it between clouds requires complex encryption and strict access rules.
- Cost Visibility: Gathering and understanding billing records from three different vendors makes true cost tracking difficult.
- Integration Issues: Open-source and commercial tools sometimes struggle to connect smoothly to every single cloud service simultaneously.
Real-World Enterprise Use Cases
Banking
- Business Challenge: A global bank needed to detect fraudulent transactions instantly, but their customer records were stored on Azure while their live transaction systems ran on AWS.
- Multi-Cloud Environment: AWS and Microsoft Azure.
- Monitoring Approach: They deployed a unified DataOps platform that monitored data freshness across both clouds, ensuring transaction records were matched with customer profiles in under two seconds.
- Business Outcome: The bank stopped millions of dollars in fraudulent charges while keeping false positives at an all-time low.
Healthcare
- Business Challenge: A hospital network needed to analyze patient health records from different regional systems while strictly following privacy laws.
- Multi-Cloud Environment: AWS and GCP.
- Monitoring Approach: The team used automated pipeline health tools to track data lineage, proving exactly how patient data was masked and moved between clouds.
- Business Outcome: The hospital safely discovered new patient care trends while maintaining absolute regulatory compliance.
Retail
- Business Challenge: A multinational retail brand struggled with inventory shortages because online sales data on GCP did not match warehouse logistics data on Azure.
- Multi-Cloud Environment: GCP and Microsoft Azure.
- Monitoring Approach: They built real-time data quality monitoring to flag any mismatches in product codes or stock counts between the two clouds.
- Business Outcome: Out-of-stock occurrences dropped by 35%, significantly improving customer satisfaction.
Manufacturing
- Business Challenge: A car manufacturer experienced factory line delays because IoT sensor data on AWS took too long to reach analytics dashboards on GCP.
- Multi-Cloud Environment: AWS and GCP.
- Monitoring Approach: They set up processing latency alerts that immediately notified engineers if data transfer times between the clouds slowed down.
- Business Outcome: Factory uptime increased because maintenance teams received machinery warnings on time.
Telecommunications
- Business Challenge: A mobile network operator faced massive cloud bills due to unoptimized network logs constantly moving between different cloud platforms.
- Multi-Cloud Environment: AWS, Azure, and GCP.
- Monitoring Approach: The company implemented cost monitoring tools that tracked data egress fees across all three cloud networks.
- Business Outcome: The telecom operator optimized their data routing paths, reducing monthly cloud bills by 20%.
E-commerce
- Business Challenge: An online marketplace suffered website crashes during holiday sales because customer recommendation data pipelines on AWS broke under heavy traffic.
- Multi-Cloud Environment: AWS and Azure.
- Monitoring Approach: The team built automated alerting and infrastructure scaling metrics into their DataOps pipeline.
- Business Outcome: The data pipelines automatically scaled up during traffic spikes, ensuring zero downtime during major shopping events.
Future Trends
The world of multi-cloud monitoring is evolving rapidly. Here is what to expect in the coming years:
- AI-Powered Monitoring: Artificial intelligence will study your pipelines, learn what “normal” behavior looks like, and spot subtle anomalies that humans miss.
- Predictive DataOps: Systems will predict pipeline failures hours before they happen based on minor changes in data volume or server performance.
- Intelligent Observability: Observability tools will automatically fix simple errors, such as restarting a stuck data job or cleaning a corrupted text field without human intervention.
- Self-Healing Pipelines: If a cloud service goes down, the pipeline will automatically reroute data to a backup cloud provider on its own.
- Unified Cloud Monitoring: Cloud providers will build better standard integrations, making it much easier to share monitoring metrics out of the box.
- Real-Time Anomaly Detection: Systems will analyze data quality instantly as data streams through, blocking bad rows of data in milliseconds.
- Automated Root Cause Analysis: When a pipeline breaks, the monitoring tool will instantly point to the exact line of broken code or missing database column responsible for the issue.
Comparison Tables
Single-Cloud vs. Multi-Cloud Pipeline Monitoring
| Feature | Single-Cloud Monitoring | Multi-Cloud Monitoring | Business Impact |
| Tooling | Built-in cloud tools work perfectly. | Requires third-party, cloud-agnostic tools. | Unified tools prevent data silos. |
| Complexity | Low; single set of rules and logs. | High; requires matching diverse log formats. | Proper multi-cloud setups require specialized skills. |
| Cost Tracking | Straightforward billing dashboard. | Complex; requires combining separate cloud bills. | Better tracking prevents unexpected cost spikes. |
| Data Lineage | Easy to trace within one ecosystem. | Challenging; requires tracking across networks. | Cross-cloud lineage guarantees data trustworthiness. |
Key Metrics for Monitoring Multi-Cloud Pipelines
| Metric | Purpose | Business Benefit | Example |
| Data Freshness | Tracks how up-to-date the data is. | Ensures decisions are based on the latest info. | Flagging if sales data is older than 30 minutes. |
| Pipeline Success Rate | Measures the percentage of jobs that finish. | Proves overall system stability. | Maintaining a 99.9% success rate over a busy weekend. |
| Processing Latency | Tracks the time data takes to travel. | Guarantees real-time or fast delivery. | Finding a slow network connection between AWS and GCP. |
| Error Rate | Tracks the frequency of broken steps. | Catches systemic bugs instantly. | Spotting a sudden 5% jump in failed database writes. |
FAQs
Q1: Can I use AWS CloudWatch to monitor data pipelines on Google Cloud?
A1: No, native tools like AWS CloudWatch are designed only for their own cloud. To monitor pipelines across different providers, you need to use cloud-agnostic DataOps monitoring tools.
Q2: What is the difference between data monitoring and data observability?
A2: Data monitoring tells you that a pipeline has failed by sending an alert. Data observability goes deeper, providing the context, logs, and lineage to help you understand exactly why it failed.
Q3: Why are egress fees important in multi-cloud pipeline monitoring?
A3: Cloud providers charge egress fees when you move data out of their network. Cost monitoring tracks these fees to prevent your multi-cloud setup from becoming unexpectedly expensive.
Q4: How does a schema change break a multi-cloud data pipeline?
A4: If an engineer changes a table structure in one cloud, the downstream applications in another cloud will not recognize the new structure, causing the pipeline to fail.
Q5: What is data lineage and why should beginners care about it?
A5: Data lineage is a visual map showing the journey of data from its origin to its destination. It helps beginners easily trace where data came from and where errors occurred.
Q6: How often should data quality validation checks run?
A6: Data quality checks should run continuously. In a healthy DataOps environment, automated tests validate data at every major stage of the pipeline.
Q7: Can small businesses benefit from multi-cloud data pipelines?
A7: While small businesses usually start with a single cloud to save money, those growing quickly or using specialized AI tools across different clouds can benefit from multi-cloud setups.
Q8: What does it mean if a pipeline has low processing latency?
A8: Low processing latency means data moves through your system very quickly, allowing business users to access fresh reports almost instantly.
Q9: What are self-healing data pipelines?
A9: Self-healing pipelines are intelligent systems that automatically fix common, simple issues—like restarting a timed-out server—without needing a human engineer to intervene.
Q10: Is it difficult to learn multi-cloud data engineering?
A10: It can be challenging at first because you must learn different cloud terminologies, but focusing on core, cloud-agnostic DataOps practices makes the transition much smoother.
Conclusion
Building a multi-cloud data infrastructure offers businesses unparalleled flexibility, power, and freedom. However, that freedom is only valuable if your data remains highly accurate and accessible. Effective monitoring of multi-cloud pipelines helps organizations improve data reliability, maintain high data quality, detect issues faster, and support confident business decisions. By embracing modern DataOps monitoring practices, companies can turn complex, scattered data pipelines into clear, manageable, and highly efficient systems. Successful data delivery across cloud environments ultimately combines automated testing, deep observability, strict governance, and continuous optimization. When you focus on these core principles, your business can confidently harness the full power of the cloud.
