A retail company runs its order pipeline in AWS. Its analytics system sits in Google Cloud. Its reporting layer runs on Azure. One morning, a report shows stale numbers. The problem actually started hours earlier, in a different cloud entirely.
The team spends the next two hours jumping between three separate dashboards, trying to piece together what happened.
This is a common struggle for DataOps teams today. When data flows across multiple clouds, watching it becomes much harder. This is exactly why multi-cloud monitoring matters.
What Is Multi-Cloud?
Multi-cloud means using more than one cloud provider at the same time.
A company might store data in AWS, run analytics in Google Cloud, and handle reporting in Azure. Each cloud does a different job.
This setup is common today. Companies often pick the best cloud service for each specific need, instead of relying on just one provider.
What Is Multi-Cloud Monitoring?
Multi-cloud monitoring means watching your systems, pipelines, and data across all the clouds you use, not just one.
This includes tracking compute resources, storage, databases, logs, and metrics, no matter which cloud they live in.
The goal is simple: one clear view, even when your data spreads across different places.
Why DataOps Teams Use Multi-Cloud Environments
Teams choose multi-cloud setups for several reasons.
- Using different cloud services – Each cloud provider has its own strengths.
- Avoiding dependence on one provider – Spreading workloads reduces risk.
- Supporting different business needs – Different teams may prefer different tools.
- Data migration – Companies sometimes move data between clouds over time.
- Regional needs – Some clouds work better in certain regions.
- Using specialized cloud services – Certain tools only exist on specific platforms.
- Supporting mergers or different teams – Combined companies often inherit different cloud setups.
Not every company needs multi-cloud. But for many, it happens naturally over time.
Why Monitoring Becomes Hard in Multi-Cloud Environments
Multi-cloud brings real monitoring challenges.
- Different cloud dashboards – Each cloud has its own separate view.
- Different monitoring systems – Tools don’t always work the same way across clouds.
- Different log formats – Logs from AWS may look nothing like logs from Azure.
- Different metrics – Each cloud may measure things slightly differently.
- Data silos – Information stays stuck in separate systems.
- Many alerts – More clouds often mean more alerts to manage.
- Service dependencies – One cloud’s problem can affect another cloud’s service.
- Cross-cloud network issues – Data moving between clouds can face delays or failures.
- Data movement delays – Pipelines crossing clouds can lag behind schedule.
- Cost tracking problems – Costs get harder to track across separate billing systems.
- Security and access issues – Each cloud has its own access rules to manage.
These problems build up quickly, especially as pipelines grow more complex.
What Are Multi-Cloud Monitoring Tools?
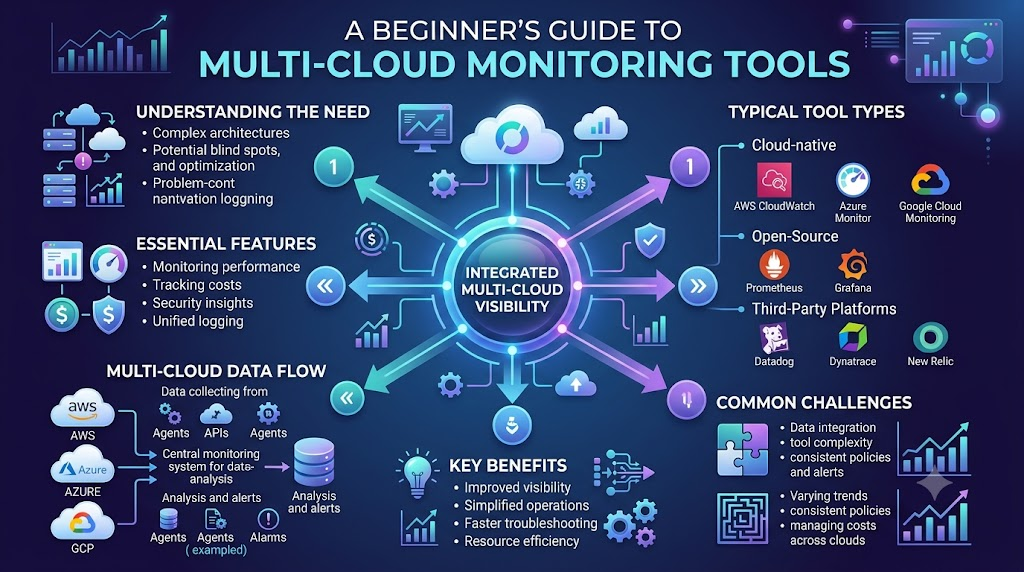
Multi-cloud monitoring tools help teams collect and view information from different cloud environments in one place.
Instead of checking three separate dashboards, a team can see pipeline health, system status, and alerts together.
Not every tool works the same way. Features and coverage can vary quite a bit between different monitoring products.
How Multi-Cloud Monitoring Works
The basic flow usually looks like this:
Cloud Services → Data Collection → Logs and Metrics → Central Monitoring → Alerts → Investigation → Action
- Cloud Services – Your workloads run across AWS, Azure, Google Cloud, or others.
- Data Collection – Monitoring agents or connectors gather data from each cloud.
- Logs and Metrics – This raw data gets organized into logs and metrics.
- Central Monitoring – Everything comes together in one dashboard or system.
- Alerts – The system flags issues based on rules or patterns.
- Investigation – Engineers review the alert and dig into the cause.
- Action – The team fixes the problem, or takes the next needed step.
What Should Multi-Cloud Monitoring Tools Track?
Good monitoring covers several different areas.
Infrastructure Health
This includes CPU, memory, storage, network, and compute resources across every cloud.
Data Pipeline Health
Track job failures, pipeline delays, failed tasks, retry counts, and pipeline run time.
Data Quality
Watch for missing data, duplicate records, schema changes, unexpected values, and data freshness.
Cloud Service Health
Keep an eye on the specific cloud services that support your data workloads, like storage services or managed databases.
Cost
Track storage cost, compute usage, data transfer, and cross-cloud data movement, since costs can add up fast across multiple clouds.
Multi-Cloud Monitoring vs Single-Cloud Monitoring
| Area | Single-Cloud Monitoring | Multi-Cloud Monitoring |
|---|---|---|
| Cloud coverage | Limited to one provider | Covers multiple providers |
| Dashboards | One native dashboard | Often needs a central view |
| Data collection | Simpler, one source | More complex, multiple sources |
| Logs | One consistent format | May need format standardization |
| Alerts | Easier to manage | Needs cross-cloud alert rules |
| Cost tracking | One billing system | Multiple billing systems to track |
| Cross-cloud visibility | Not usually needed | Essential for full visibility |
Role of Data Observability
Monitoring and observability are related, but they are not the same thing.
Monitoring tells the team that something is wrong. For example, a pipeline failed.
Observability helps the team understand what happened and why. For example, it shows which step failed, what data was affected, and what changed before the failure.
TheDataOps.org describes monitoring as tracking known signals, while observability adds deeper context to help teams understand unexpected problems. Think of monitoring as the alarm, and observability as the investigation tools that follow.
Centralized Monitoring Dashboard
A central dashboard brings together data from every cloud into one place.
This can include:
- A common view of system health
- Shared metrics across clouds
- Alert status in one place
- Pipeline health
- Cloud health
- Data quality results
- Cost information
With a central dashboard, teams spend less time switching between different cloud consoles. They can see the full picture faster.
Unified Logging
Logs from different clouds often use different formats. This makes it hard to search or compare them.
Unified logging brings these logs into a common format. This helps teams search across clouds and investigate problems much faster.
TheDataOps.org recommends unified logging as part of any strong multi-cloud pipeline monitoring setup.
Alerts in Multi-Cloud Monitoring
Alerts need careful handling in multi-cloud setups.
Key areas to manage include:
- Alert rules – Clear rules for what counts as a real issue.
- Alert severity – Not every alert needs urgent action.
- Duplicate alerts – The same issue may trigger alerts in more than one cloud.
- Alert noise – Too many low-value alerts make it hard to focus.
- Alert fatigue – Constant alerts can cause teams to start ignoring them.
- Alert routing – Alerts should reach the right team.
- Team notifications – Clear, timely alerts help teams respond faster.
Simple example: A pipeline failure in AWS might also trigger a related alert in Azure, where the data was supposed to land. Without proper handling, this looks like two separate problems, instead of one.
Data Pipeline Monitoring Across Multiple Clouds
A single pipeline can move through several clouds before it’s done.
Example flow: AWS → Azure → Google Cloud → Data Warehouse → Dashboard
At each step, a DataOps team should watch:
- Whether data arrived on time
- Whether the transfer completed without errors
- Whether the data format stayed consistent
- Whether downstream systems received clean data
TheDataOps.org discusses end-to-end monitoring for pipelines that cross AWS, Azure, and Google Cloud, since a break at any single step can affect everything downstream.
Important Features of Multi-Cloud Monitoring Tools
Useful features to look for include:
- Multi-cloud support
- Central dashboard
- Metrics tracking
- Log collection
- Alerting
- Data quality checks
- Pipeline monitoring
- Data observability
- Anomaly detection
- Service health checks
- Cost visibility
- Access control
- Integration support
- Reporting
Not every tool includes every feature listed here. It’s worth checking which ones matter most for your setup.
Simple Example of Multi-Cloud Monitoring
A retail company stores customer data in AWS. Its analytics system runs in Google Cloud. Its reporting system uses Azure. A pipeline moves data between all three.
A monitoring system can help the team watch:
- Data transfer between clouds
- Pipeline status at each step
- Data freshness in the final report
- Errors during transfer or processing
- Cloud resource use
- Alerts from any of the three clouds
- Overall cost across all three platforms
With this setup, if a report looks stale, the team can trace the issue back to its real source, instead of guessing.
Benefits of Multi-Cloud Monitoring Tools
- Better visibility – One view across all your clouds.
- Faster problem detection – Issues get caught sooner.
- Easier troubleshooting – Less time spent switching dashboards.
- Better pipeline reliability – Problems get fixed before they spread.
- Better data quality checks – Issues in data get caught early.
- Centralized alerts – Fewer places to check for problems.
- Easier cost tracking – Costs become easier to see and manage.
- Better team coordination – Shared visibility helps teams work together.
Challenges of Multi-Cloud Monitoring
- Tool integration – Not all tools connect easily with every cloud.
- Different cloud services – Each cloud has its own quirks.
- Different data formats – Logs and metrics may need translation.
- Security – Managing access across clouds takes careful planning.
- Access management – Permissions can get complex fast.
- Large data volumes – More clouds often mean more data to monitor.
- Cross-cloud latency – Data moving between clouds can be slow.
- Cost – Monitoring tools and data transfer both add expense.
- Alert noise – More systems can mean more low-value alerts.
- Skill requirements – Teams need knowledge across multiple platforms.
Best Practices for Multi-Cloud Monitoring
- Start with critical data pipelines. Focus on what matters most first.
- Create common monitoring rules. Keep rules consistent across clouds where possible.
- Use a central dashboard where useful. This reduces console-switching.
- Standardize logs. Common formats make investigation easier.
- Track data quality. Catch bad data before it spreads downstream.
- Monitor data freshness. Know when data is outdated.
- Set useful alert rules. Avoid alerts that don’t need action.
- Track cross-cloud data movement. Watch how data flows between clouds.
- Review cloud costs. Keep an eye on spending across all platforms.
- Test monitoring rules often. Make sure alerts still work as systems change.
How to Choose a Multi-Cloud Monitoring Tool
Consider these factors when evaluating a tool:
- Cloud support
- Data pipeline support
- Monitoring features
- Data observability capabilities
- Alerting options
- Integration options
- Ease of use
- Scalability
- Security
- Cost
- Reporting
- Your team’s specific needs
There’s no single “best” tool for every team. The right choice depends on your setup and priorities.
Common Mistakes to Avoid
- Monitoring only infrastructure – Ignoring data quality and pipeline health.
- Ignoring data quality – Missing bad data until it causes real problems.
- Creating too many alerts – Leading to alert fatigue.
- Using different rules for every cloud – Making patterns hard to spot.
- Ignoring data movement costs – Letting cross-cloud transfer costs grow unchecked.
- Not tracking pipeline dependencies – Missing how one failure affects others.
- Not testing alerts – Finding out alerts don’t work during a real incident.
- Depending only on native cloud dashboards – Missing the full cross-cloud picture.
Future of Multi-Cloud Monitoring in DataOps
Multi-cloud monitoring will likely keep improving in a few key areas:
- Better cross-cloud visibility
- More automation in data collection
- Smarter, more relevant alerts
- Better anomaly detection
- Improved data observability
- Automated pipeline health checks
- Better cost visibility across clouds
These improvements should make life easier for DataOps teams, though tools will still need proper setup and regular review to work well.
FAQs
1. What is multi-cloud monitoring?
It means watching your systems, pipelines, and data across more than one cloud provider, all from a connected view.
2. Why is multi-cloud monitoring important for DataOps?
Because data pipelines often cross multiple clouds, and problems in one cloud can affect systems in another.
3. What should a multi-cloud monitoring tool track?
It should track infrastructure health, pipeline health, data quality, cloud service health, and cost across all clouds used.
4. How does multi-cloud monitoring help data pipelines?
It helps teams spot failures, delays, and data quality issues at each step, even when a pipeline crosses several clouds.
5. What is the difference between monitoring and observability?
Monitoring tells you something is wrong. Observability helps you understand what happened and why.
6. Can one dashboard monitor multiple clouds?
Yes, many tools offer a central dashboard that pulls data from different cloud providers into one view.
7. How can teams reduce alert noise in multi-cloud setups?
By setting clear alert rules, removing duplicate alerts, and grouping related alerts from the same root cause.
8. Why should data quality be monitored across clouds?
Because bad data in one cloud can spread downstream and affect reports or analytics in another cloud.
9. How can teams track multi-cloud costs?
By using monitoring tools that show storage, compute, and data transfer costs across all cloud providers in one place.
10. What should teams check before choosing a monitoring tool?
They should check cloud support, pipeline monitoring features, alerting, ease of use, security, and overall cost.
Conclusion
Multi-cloud setups bring real benefits, but they also make monitoring harder. Different dashboards, log formats, and alert systems can leave teams guessing where a problem actually started.
Multi-cloud monitoring tools help by bringing this scattered information into one place. With a central view, standardized logs, and clear alerts, DataOps teams can catch problems faster and keep pipelines running reliably, no matter how many clouds they touch.
