Dynatrace Training Course & Certification Program

In the intricate tapestry of the digital world, application and infrastructure monitoring are pivotal. Understanding its profound significance, DevOpsSchool is ecstatic to announce the commencement of its “Dynatrace Certification Program” on 14th October 2023.

Why Dynatrace Certification with DevOpsSchool?

  1. Mentored by the Best: Spearheading the training will be the industry stalwart, Rajesh Kumar. His unparalleled expertise combined with practical insights promises an enriching learning experience for every participant.
  2. Holistic Dynatrace Emphasis: While the domain of application performance monitoring has multiple players, Dynatrace emerges as the unrivaled leader. Our course curriculum is meticulously crafted to delve deep into Dynatrace’s nuances, ensuring you are certification-ready by the program’s culmination.
  3. Round-the-Clock Support: DevOpsSchool’s commitment to your learning doesn’t end with the training sessions. Whether you need assistance with a particular topic, post-training support, or consulting, our team is on standby, ensuring uninterrupted support.
  4. Thorough Course Content: The training encompasses every facet of Dynatrace. From basic setup and configuration to advanced monitoring and analytics, rest assured, you’ll emerge from this program with a comprehensive grasp of Dynatrace.

Why is the Dynatrace Certification a Must-Have?

In today’s fast-paced digital landscape, ensuring optimal application performance is not just essential; it’s critical. Dynatrace, with its AI-driven analytics and full-stack monitoring capabilities, stands out as the go-to solution for businesses worldwide.

Being Dynatrace-certified not only endorses your skills in this niche domain but catapults you to the forefront in the competitive job market. If application and infrastructure monitoring is your calling, the Dynatrace Certification is your badge of mastery.

Enrollment & Contact Information:

Opportunities like these are rare and sought after. If you’re keen on upskilling and securing this competitive edge:

Dynatrace Certification

In addition to Terraform Certification, we also offer training and certification for Dynatrace. Dynatrace is a leading application performance monitoring (APM) tool. Dynatrace certification is a valuable credential for anyone who wants to work with Dynatrace.

Training

We offer a variety of training courses on Terraform and Dynatrace. Our training courses are designed to help you learn the fundamentals of Terraform and Dynatrace and prepare you for the respective certification exams.

Course

Our Terraform Certification Program is a comprehensive course that covers all aspects of Terraform. The course includes hands-on labs and exercises to help you learn the Terraform technology.

Certification

We offer certification for Terraform and Dynatrace. Our certifications are designed to assess your knowledge and skills in Terraform and Dynatrace.

One

We are a one-stop shop for all your Terraform and Dynatrace training and certification needs.

Support

We provide support to our students before, during, and after the training. We are available to answer your questions and help you to troubleshoot any problems you may encounter.

Consulting

We also offer consulting services for Terraform and Dynatrace. We can help you to implement Terraform and Dynatrace in your environment.

To enroll in the Terraform Certification Program or to learn more about our Dynatrace training and certification programs, please visit our website or call us at +91 7004 215 841.

Description:

Dynatrace online training program will help you learn the Dynatrace certification master program which is a global tech company that is an intelligence platform based on artificial intelligence (AI) and software automation process to monitor and optimize application performance, development part and security management, IT infrastructure, and user experience for businesses configure levels and government agencies throughout the world.

In this online Dynatrace certification course, you will become a master in Dynatrace tool with microservices, container orchestration platforms such as Kubernetes, and the IT infrastructure which is running in multi-cloud and hybrid-cloud system environments and provides full automated problem resolving remediation.

This Dynatrace certification course, designed in collaboration with DevOpsSchool under the “ Monitoring performance team” program and this is the mere certification course in the world that provides one month of internship with Real intelligence-based Projects in one of the software industries and experiences real implementations of Dynatrace’s best practices. This program also would help you with Dynatrace interview and assessment preparations.

Key highlights:

DevOps Tools Included
20 live & interactive sessions
Certified by Devopsschool
Lifetime access with video library
Real Scenario based projects
Interview & assessment support
60 Hrs. projects & exercises
Designed for working professional & fresher’s
250 hrs. self-paced learning videos

Upcoming Batches:

1st month of every week

Eligibility

  • Application developers
  • Integration specialists
  • Solution architect
  • Master in engineer
  • Software prodigy
  • Security analyst
  • IT experts and professionals
  • Software performer
  • Fresher’s looking to become a Dynatrace certified engineer
  • Aspirants looking to work as Dynatrace professional can apply for this course.

Skills covered

  • Participating in Management Reviews and Analysis.
  • Defining dashboard and reporting engagement performance
  • Identify dependencies, constraints, risks, and issues
  • Reviewing and providing inputs for all the test results
  • Effective stakeholder communication
  • Provide weekly status report to Client
  • Facilitate root cause analysis

Tools covered

  • Amazon Web Services (AWS)
  • Docker
  • Java
  • Prometheus
  • Microsoft Azure
  • Google Cloud Platform
  • microservices
  • Kubernetes

Curriculum & course details

  • Introduction
  • APM Introduction
  • understanding dynatrace
  • Basic Installation
  • Web Interface Licensing
  • Performance analysis
  • Create Web Applications for Real User Monitoring.
  • Create Tagging rules
  • Windows service availability
  • Setup notification problem with the help of alerting profiles
  • Monitoring log files through dynatrace
  • Detecting application flow & technologies through Dynatrace
  • AWS infrastructure monitoring & diagnostic tools in Dynatrace
  • Reports & Dashboards in Dynatrace

Certification

Daily upcoming certification, you have been cross-checked in your IT career and Industry related to your courses but you know the Certifications always play a pleasant role in any profession. You may find some Dynatrace professionals, who will tell you that certifications do not hold much value; this certification demonstrates an individual’s ability to resolve complex clouds, digital analytics, and dashboards with Dynatrace core software to get the most out of their data.

A Dynatarce Certified User can monitor, use fields, use lookups, and create basic statistical performance and dashboards in the Dynatarce Enterprise or Dynatarce Cloud Platforms. This certification demonstrates an individual’s ability to navigate and use the Dynatrace Software.

Reviews

What do aspirants think about our certification program?

With over 150 countries aspirants, DevOpsSchool certification can be an accredited to every individual and any organization who is looking to adopt and implement software delivery and operational best practices. Here I have consolidated a few recent observations made by our certified aspirants regarding their results with Devopsschool.

Referral links of nine videos

https://youtu.be/BggCJYfPNdc
https://youtu.be/zST07939aiQ
https://youtu.be/-7Q_uC0Pr80
https://youtu.be/NvB0L1rY_54
https://youtu.be/HgclhiZE1FU
https://youtu.be/D3h3c0UUcPs
https://youtu.be/pvzS-ZrAE5Q
https://youtu.be/-sbbJloHhEM
https://youtu.be/CW1yjL27GzA

Projects and internship

  • OpenTelemetry Collector Contrib
  • Dynatrace OpenTelemetry analysis Metrics Exporter for Java
  • Dynatrace OpenTelemetry contibutes Metrics Exporter to Go
  • Dynatrace OpenTelemetry Metrics Exports for Python working
  • Dynatrace OpenTelemetry Metrics Exports to JavaScript for managing
  • Dynatrace OpenTelemetry Metrics Exporter for .NET

FAQs

What is Smartscape topology in Dynatrace?

Smartscape topology is a real-time, dynamic topology map that provides a comprehensive view of your entire application environment. It automatically discovers and maps all of the components in your environment, including services, hosts, processes, and dependencies. Smartscape topology also provides insights into the performance and health of your environment, so you can quickly identify and troubleshoot problems.

How do I monitor services in Dynatrace?

There are a few different ways to monitor services in Dynatrace:

  • Use the Smartscape topology map: The Smartscape topology map provides a high-level overview of the performance and health of your services. You can click on any service in the map to view more detailed information, such as CPU usage, memory usage, and response times.
  • Use the service list: The service list provides a tabular view of all of the services in your environment. You can use the service list to filter and sort services, and to view detailed information about each service.
  • Use the service dashboards: Dynatrace provides a variety of pre-built service dashboards that you can use to monitor the performance and health of your services. These dashboards provide insights into different aspects of service performance, such as throughput, latency, and errors.

What is Backtrace in Dynatrace?

A backtrace is a stack trace that shows the sequence of function calls that led to a particular event, such as an error or a performance problem. Dynatrace provides backtraces for all errors and performance problems that are detected in your environment. You can use backtraces to identify the root cause of problems and to fix them.

What is called service in Dynatrace?

In Dynatrace, a service is a logical grouping of related components. A service can be a single component, such as a web server, or it can be a complex system composed of multiple components, such as a microservices architecture. Dynatrace uses services to organize and monitor your application environment.

What is Purepath in Dynatrace?

Purepath is a feature in Dynatrace that allows you to trace end-to-end transactions across your entire application environment. Purepath shows you the flow of a transaction through your system, from the initial request to the final response. This can help you to identify performance bottlenecks and to troubleshoot problems.

How do you trace your back?

To trace your back in Dynatrace, you can use the backtrace feature. Backtraces are available for all errors and performance problems that are detected in your environment. To view a backtrace, click on the error or performance problem in the Dynatrace console. The backtrace will show you the sequence of function calls that led to the problem.

What environments does Dynatrace support?

Dynatrace supports a wide range of environments, including:

  • Cloud environments: Dynatrace supports all major cloud providers, including AWS, Azure, and GCP.
  • On-premises environments: Dynatrace supports on-premises environments running Windows, Linux, and Unix.
  • Containerized environments: Dynatrace supports containerized environments running Docker and Kubernetes.

What is transaction and services in Dynatrace?

A transaction is a business-level operation that spans multiple services. A service is a logical grouping of related components. Dynatrace uses transactions to monitor the performance and health of your application environment. You can use transactions to identify performance bottlenecks and to troubleshoot problems.

What is Dynatrace deep monitoring?

Dynatrace deep monitoring is a feature in Dynatrace that provides in-depth insights into the performance and health of your application environment. Deep monitoring uses a variety of techniques to collect data from your environment, including code instrumentation, real user monitoring, and synthetic monitoring. This data is then used to generate reports and dashboards that provide insights into different aspects of your environment, such as performance, errors, and resource utilization.

1. What makes Dynatrace different?

Dynatrace distinguishes itself from other monitoring tools by offering an all-in-one, AI-powered platform. Its artificial intelligence capabilities help in the automatic detection of performance anomalies and provide root cause analysis. Additionally, Dynatrace’s “SmartScape” feature visualizes the entire IT environment, from applications and infrastructure to user experiences, enabling a holistic monitoring approach.


2. What kind of tool is Dynatrace?

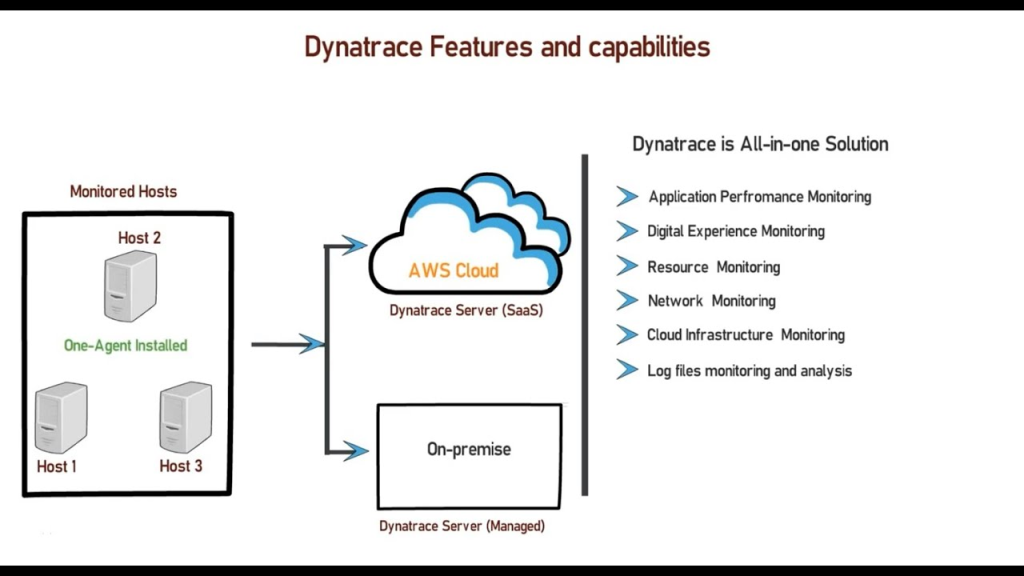
Dynatrace is a full-stack monitoring tool that provides Application Performance Management (APM), Infrastructure Monitoring, Digital Experience Monitoring (including real user and synthetic monitoring), and Cloud Automation capabilities. It caters to both cloud-native and traditional applications and infrastructure.


3. How does Dynatrace monitoring work?

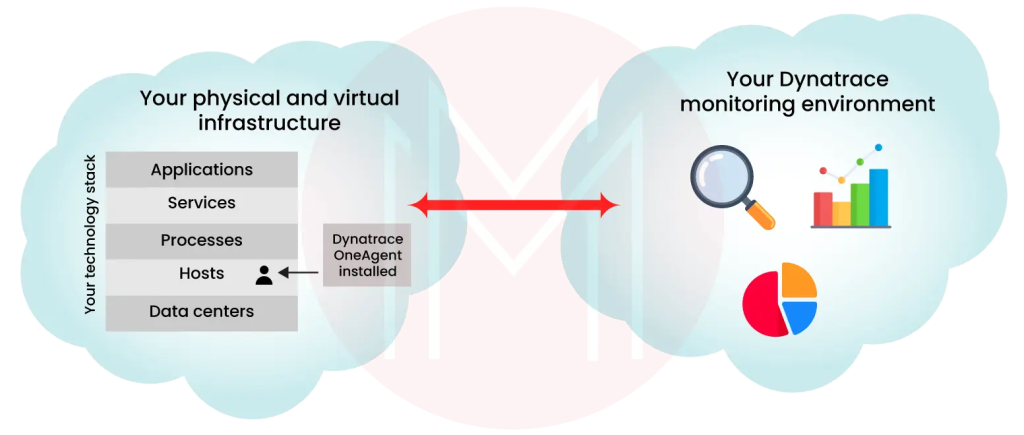
Dynatrace monitoring works using the OneAgent technology, which is a set of agents installed on hosts, VMs, or within containers. OneAgent collects data about the performance of applications, services, and infrastructure. It auto-discovers all components, dependencies, and visualizes them in SmartScape. The collected data is then processed by Dynatrace’s AI engine, Davis, which automatically detects anomalies and provides root cause analysis.


4. What is Dynatrace documentation?

Dynatrace documentation refers to the comprehensive set of resources, manuals, and guides provided by Dynatrace to assist users in understanding, implementing, and maximizing the platform. This documentation covers topics ranging from installation and configuration to advanced features and best practices.


5. What is mission control in Dynatrace?

Mission Control in Dynatrace is a service that offers 24/7 environment health monitoring. It is operated by Dynatrace experts who continuously monitor the health of Dynatrace clusters, ensuring optimal performance and assisting in troubleshooting if any issues arise.


6. What are Dynatrace alerts?

Dynatrace alerts are notifications generated by the platform when performance anomalies or problems are detected. These alerts are driven by the AI-engine, which automatically identifies issues, their impact, and the potential root cause. Users can customize the alerting thresholds and integrate with various notification channels.


7. What is true about baselines in Dynatrace?

In Dynatrace, baselines are dynamic and are continuously recalculated using AI. They represent the “normal” behavior of your applications, services, or infrastructure. When the monitored metrics deviate significantly from these baselines, Dynatrace generates alerts. This dynamic baseline approach enables more accurate alerting as it adjusts to regular changes in the environment.


8. How does Dynatrace Group Mobile app crashes?

Dynatrace provides in-depth mobile app monitoring, which includes tracking crashes. When a crash occurs, Dynatrace captures detailed crash reports, grouping them by similarity. This helps developers understand the frequency, impact, and root cause of each crash type, enabling quicker troubleshooting and resolution.


9. What is visualized in a service flow Dynatrace?

In Dynatrace, a service flow visualizes the path of requests as they traverse through different services, databases, and other components in your environment. It provides insights into the sequence, dependencies, and interactions between components, and helps in understanding the performance impact at each step, making it a vital tool for troubleshooting and performance optimization.