Introduction
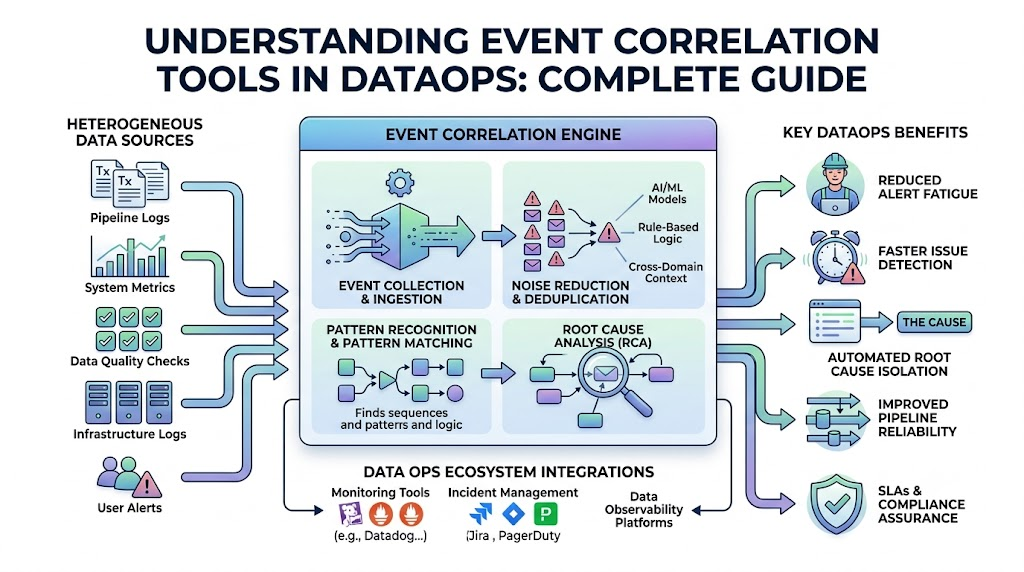
Modern enterprise data architectures run hundreds of pipelines every day. Data flows continuously from relational databases, cloud stores, third-party APIs, and streaming brokers into analytical data warehouses and data lakes. When a single transformation step fails or experiences schema drift, it can trigger a cascade of secondary failures across downstream analytical models, machine learning algorithms, and business intelligence dashboards. Without specialized management tooling, data engineering teams face alert fatigue. Engineers receive hundreds of isolated notifications warning of job timeouts, memory limits, null values, and delayed table refreshes. Finding the actual cause of an incident behind hundreds of alerts requires time and manual effort. At TheDataOps.org, our mission is to provide clear educational resources, technical frameworks, and practical guidance to help data teams build resilient, automated, and observable data operations.
What is DataOps?
DataOps (Data Operations) is an automated, goal-oriented discipline that brings agile development, DevOps practices, and statistical process control to data management. Its primary objective is to deliver high-quality, reliable data rapidly from source systems to business consumers.
+-----------------------------------------------------------------------+
|                           THE DATAOPS CYCLE                           |
|                                                                       |
|  [ Source Data ] ---> ( Agile Development & CI/CD )                   |
|                               |                                       |
|                               v                                       |
|  [ Consumers ]   <--- ( Automated Testing & Monitoring ) <---+        |
|         |                                                    |        |
|         +----------------> ( Statistical Process Control ) --+        |
+-----------------------------------------------------------------------+
Traditional data management often relies on manual testing, siloed teams, and reactive troubleshooting. When an analytical report displays wrong metrics, business teams notify data engineers, who then manually trace back through transformation pipelines to identify what broke. This manual approach leads to high operational costs, delayed insights, and low trust in enterprise data.
DataOps replaces reactive habits with automated continuously monitored pipelines. It applies continuous integration and continuous deployment (CI/CD) practices to data code, automates data validation checks at ingestion, and continuously tracks pipeline operations. By treating data pipelines as software production assets, DataOps helps organizations lower delivery cycle times while maintaining high data freshness, accuracy, and lineage visibility.
Understanding Events in Modern Data Pipelines
In a data environment, an event is any observable change, status update, or action recorded by a data system, orchestration engine, or database during pipeline execution.
Data pipelines generate thousands of discrete events every minute. These events fall into four primary operational categories:
- Job and Process Events: Signal start, progress, retry, success, or failure states from orchestrators like Apache Airflow, Dagster, or Prefect.
- Data Quality and Validation Events: Triggered when schema drift occurs, null value thresholds are exceeded, column values fall out of range, or duplicate rows are detected by tools like Soda or Great Expectations.
- Infrastructure and System Events: Generated by underlying compute environments like Kubernetes pods, AWS EC2 instances, Snowflake virtual warehouses, or Spark clusters reporting CPU spikes, memory limits, or network timeouts.
- Data Flow and Lineage Events: Record changes in data arrival times, stream ingestion rates, table row count variations, or structural updates in target tables.
When an operational failure occurs—such as a source database altering a column type without notice—it generates a sequence of events:
[ Source DB Schema Change ]
       │
       ▼
[ Ingestion Job Fails: Type Mismatch ]
       │
       ▼
[ Staging Table Null Values Detected ]
       │
       ▼
[ Downstream dbt Model Build Aborted ]
       │
       ▼
[ BI Dashboard Refresh Timeout ]
A single failure point can generate dozens of separate failure events across different layers of your data stack.
What is Event Correlation?
Event Correlation is the process of collecting, analyzing, and grouping large volumes of disparate system events to discover meaningful patterns, establish logical relationships, and isolate root causes.
Instead of treating every error log, metric anomaly, or job alert as an isolated incident, event correlation engines analyze incoming events in real time. They inspect event metadata, timestamps, system dependencies, data lineage, and operational context to connect separate data points into a single operational incident.
For example, if an ingestion job fails at 02:00 AM, a staging table experiences zero row updates at 02:01 AM, and three downstream analytical models fail at 02:05 AM, an event correlation tool recognizes that these four separate events share a common cause. It groups them under a single root-cause incident ticket, explaining that the ingestion job failure at 02:00 AM caused all subsequent downstream failures.
Why Event Correlation is Important in DataOps
As enterprises migrate to modern cloud data stacks, data architectures grow more distributed. Organizations commonly combine cloud data warehouses (Snowflake, BigQuery), streaming systems (Kafka, Kinesis), transformation engines (dbt, Spark), and orchestration tools across multiple cloud environments.
This architecture introduces operational complexity that makes event correlation essential for three main reasons:
- Elimination of Alert Noise: A single pipeline failure can trigger dozens of automated notifications across Slack, email, and PagerDuty. Event correlation groups these redundant alerts into a single actionable incident summary.
- Accelerated Mean Time to Resolution (MTTR): Manually reading logs across separate platforms takes time. Event correlation highlights the exact origin of an issue, reducing investigation times from hours to minutes.
- Prevention of Cascading Failures: By detecting operational anomalies early in the data pipeline, correlation tools allow DataOps teams to pause downstream jobs automatically before corrupted or incomplete data enters production dashboards and machine learning models.
Traditional Monitoring vs Event Correlation
Understanding how traditional monitoring differs from intelligent event correlation helps highlight why event correlation tools are vital for modern data operations.
| Aspect | Traditional Pipeline Monitoring | Event Correlation in DataOps |
| Primary Focus | Individual job pass/fail statuses and isolated threshold metrics. | System-wide relationship mapping, event relationships, and root cause analysis. |
| Data Source Handling | Monitors single platforms separately (e.g., orchestrator logs alone). | Ingests and correlates logs, metrics, traces, and metadata across the entire stack. |
| Alert Management | Generates a separate alert for every failed task or broken metric. | Deduplicates and groups related alerts into a single incident report. |
| Lineage Awareness | Limited or no awareness of upstream/downstream data dependencies. | Deeply integrated with column-level and table-level data lineage maps. |
| Problem Diagnosis | Manual log inspection across multiple systems to find root cause. | Automated root cause isolation using rule logic or machine learning models. |
| Operational Impact | High alert noise, high MTTR, and frequent alert fatigue. | Low noise, rapid MTTR, and targeted operational response. |
How Event Correlation Tools Work
Event correlation tools follow a structured multi-stage data processing lifecycle to transform raw, noisy log streams into clear, actionable operational insights.
+---------------------------------------------------------------------------------+
|                       EVENT CORRELATION TOOL PIPELINE                           |
|                                                                                 |
|  [ Data Sources ]  -->  [ Step 1: Ingestion & Normalization ]                   |
|                                   │                                             |
|                                   v                                             |
|                         [ Step 2: Time Windowing ]                              |
|                                   │                                             |
|                                   v                                             |
|                         [ Step 3: Pattern & Lineage Match ]                     |
|                                   │                                             |
|                                   v                                             |
|                         [ Step 4: Deduplication & Grouping ]                    |
|                                   │                                             |
|                                   v                                             |
|  [ Incident Output ] <-- [ Step 5: Root Cause Isolation ]                      |
+---------------------------------------------------------------------------------+
Here is how each step in the event correlation engine operates:
Step 1: Event Ingestion and Normalization
The engine continuously collects logs, metrics, execution events, and metadata from pipeline tools, databases, and orchestrators via APIs, webhooks, or streaming agents. It normalizes distinct log formats (JSON, plain text, syslog) into a consistent schema with standard attributes (timestamp, component, severity level, dataset ID).
Step 2: Time-Windowing and Aggregation
Events are grouped into flexible time windows (e.g., 60-second or 5-minute sliding windows). The system evaluates events occurring close together to determine whether they belong to the same operational event sequence.
Step 3: Pattern Matching and Dependency Mapping
The engine maps incoming events against known system topology models, logical rule sets, or data lineage graphs. It checks whether an error event in System A relates to a failure event in System B based on shared data pathways.
Step 4: Deduplication and Noise Reduction
Identical alerts triggered repeatedly within a time window are merged into a single event record. Redundant alerts from downstream consumers are suppressed in favor of the primary upstream alert.
Step 5: Root Cause Isolation and Notification
The engine identifies the probable root cause, assigns a severity score, and dispatches a unified incident notification to the appropriate DataOps engineer via integrated communication tools.
Rule-Based vs AI-Powered Event Correlation
Event correlation tools rely on two main approaches for identifying relationships between operational events: Rule-Based Correlation and AI-Powered Correlation.
RULE-BASED CORRELATION:
[ Incoming Events ] --> [ Predefined IF/THEN Rules ] --> [ Static Incident Output ]

AI-POWERED CORRELATION:
[ Incoming Events ] --> [ ML Anomaly Detection + Lineage ] --> [ Dynamic Root Cause Identification ]
Rule-Based Event Correlation
Rule-based correlation relies on static, predefined rules created by data engineers. Rules dictate exact actions when specific conditions occur. For example: “IF Database_A ingestion fails AND Table_B row count is zero within 10 minutes, THEN group these events and label Database_A as the root cause.”
Rule-based systems are deterministic and predictable, making them easy to implement for static pipelines with known failure patterns. However, as data stacks expand to support hundreds of pipelines, maintaining manual rule sets becomes difficult and time-consuming.
AI-Powered Event Correlation (AIOps)
AI-powered event correlation uses machine learning algorithms, statistical anomaly detection, and natural language processing (NLP) to analyze log structures, event frequencies, and system behaviors automatically.
These engines learn baseline performance patterns across pipelines. When anomalous event clusters appear, the AI model identifies relationships without requiring manually configured rules. AI-driven systems excel in complex, dynamic cloud data stacks where data structures and ingestion schedules change frequently.
| Feature / Dimension | Rule-Based Correlation | AI-Powered Correlation |
| Setup & Configuration | Requires manual configuration of explicit IF/THEN logic. | Automated baseline learning; minimal manual rule writing. |
| Adaptability | Rigid; breaks or misses incidents when pipelines change. | Dynamic; automatically adapts to continuous schema and schedule updates. |
| Maintenance Effort | High; rules must be updated whenever pipelines expand. | Low; machine learning models continuously retrain on new data patterns. |
| Unknown Issue Detection | Poor; can only detect failure modes covered by existing rules. | High; identifies novel anomaly patterns and unmapped dependency failures. |
| Best Used For | Small, predictable environments with simple ETL workflows. | Large enterprise environments with dynamic cloud topologies and complex stacks. |
Event Collection from Logs, Metrics, Traces, and Pipeline Events
To deliver clear system visibility, event correlation tools gather operational signals across four fundamental telemetry types:
                  +-----------------------------------+
                  |   DATAOPS TELEMETRY COLLECTION    |
                  +-----------------------------------+
                                    |
       +--------------------+-------+-------+--------------------+
       |                    |               |                    |
       v                    v               v                    v
  [ LOGS ]             [ METRICS ]     [ TRACES ]       [ PIPELINE EVENTS ]
 (Execution Errors,   (Freshness,     (API Latency,    (Schema Drift, Row
  System Warnings)    Volume, Memory) Distributed Calls) Count Variations)
- Pipeline and Application Logs: Detailed, time-stamped text records produced by data applications, dbt models, custom Python scripts, and Spark jobs. Logs contain error stack traces, exception codes, and execution state details necessary to understand why a specific task failed.
- Operational Metrics: Quantitative measurements tracked over time, such as pipeline execution duration, CPU/memory utilization, table volume growth, data freshness delay, and API query throughput. Metric spikes often indicate resource bottlenecks or upstream delays.
- Distributed Traces: Performance tracking across distributed microservices and multi-cloud environments. Traces track a data payload’s journey as it passes through APIs, message queues, transformation engines, and data warehouse staging layers, highlighting exact latency bottlenecks.
- Data Observability Events: Signals specific to data health, including schema drift notifications (e.g., column dropped, data type changed), data distribution shifts (e.g., metric averages deviating from baseline), null-value percentage breaches, and data lineage shifts.
Alert Deduplication and Noise Reduction
One of the most immediate operational benefits of event correlation tools is the elimination of alert fatigue.
When a core database goes offline, modern infrastructure can trigger hundreds of alerts within minutes. Monitoring tools notify engineers about failed queries, broken connections, network timeouts, empty tables, and failing BI reports simultaneously. This floods on-call engineers with noise, making it hard to identify the actual issue.
Event correlation engines address this challenge using three targeted noise-reduction techniques:
[ 100 Raw Incoming System Alerts ]
               │
               ▼
   [ Deduplication Filter ]     --> (Merges identical repeated logs)
               │
               ▼
  [ Suppress Downstream Noise ]  --> (Silences symptom alerts via Lineage)
               │
               ▼
   [ Cluster Related Signals ]  --> (Groups related metrics & errors)
               │
               ▼
[ 1 Unified, Actionable Incident Ticket ]
- Deduplication: Merges multiple occurrences of the same alert generated within a short timeframe into a single incident record with an updated event count timestamp.
- Topological Suppression: Uses data lineage to suppress notifications from downstream assets affected by an upstream root failure. If an ingestion job fails, the tool silences downstream report failure alerts and highlights the ingestion job error instead.
- Semantic Clustering: Uses natural language parsing to group alerts with similar text patterns or error codes across separate systems, consolidating them under a shared incident thread.
Root Cause Analysis Using Event Correlation
When an enterprise data pipeline breaks, finding the root cause manually requires searching through logs across multiple isolated platforms. Event correlation automates root cause analysis (RCA) by linking technical failure signals with data asset dependencies.
Consider the following enterprise data pipeline architecture:
+-----------------------------------------------------------------------------------+
|                        DATA PIPELINE DEPENDENCY ARCHITECTURE                      |
|                                                                                   |
|  [ PostgreSQL DB ]  --->  [ Airflow Ingestion ]  --->  [ Snowflake Staging ]       |
|                                                                │                  |
|                                                                v                  |
|  [ Executive BI Dashboard ]  <---  [ dbt Data Model ]  <--- [ Spark Compute ]     |
+-----------------------------------------------------------------------------------+
Root Cause Analysis Walkthrough:
- Initial Symptom: The Executive BI Dashboard displays an error alert indicating missing data for current-day sales metrics.
- Traditional Approach: The engineer manually logs into the BI tool, checks dbt job logs, verifies Snowflake table records, inspects Airflow run histories, and reviews database connection logs. This step-by-step process can take hours.
- Event Correlation Approach: The correlation engine analyzes the timeline and lineage map:
- It detects an
ALERT 104: Column Type Mismatchin PostgreSQL at 01:45 AM. - It tracks the failure downstream to
Airflow Job: ingest_sales_rawfailing at 01:46 AM. - It notes that
Snowflake Table: stg_salesreceived 0 rows at 01:50 AM. - It observes
dbt Model: fct_daily_salesfailing at 02:00 AM due to missing staging data.
- It detects an
- Automated Incident Output: The tool generates a unified incident ticket:
- Primary Incident: Schema modification in PostgreSQL source database (
sales_amountchanged fromINTtoNUMERIC). - Blast Radius: 1 Airflow task, 1 Snowflake staging table, 1 dbt model, and 2 BI executive reports.
- Recommended Action: Update staging schema definitions in dbt to accommodate the updated source data type and re-run the ingestion DAG.
- Primary Incident: Schema modification in PostgreSQL source database (
Predictive Event Analytics with Machine Learning
Modern event correlation tools go beyond reacting to existing pipeline failures; they use machine learning models to anticipate and prevent data outages before business users notice them.
Predictive event analytics models operate continuously in the background:
- Anomaly Baseline Learning: Machine learning models study historical pipeline behaviors—such as average job completion times, typical row volumes ingested on specific days, and normal CPU usage trends.
- Pattern Recognition: The system identifies subtle early-warning signs that historically lead to system failures. For instance, if data ingestion rate slows by 15% every hour while temporary storage usage steadily rises, the engine recognizes a memory leak pattern.
- Proactive Interventions: Upon identifying a failure pattern, the system sends a predictive warning to the DataOps team or triggers automated resolution actions (such as auto-scaling compute capacity, clearing temporary caches, or throttling non-critical batch jobs).
Integration with Data Observability Platforms
Event correlation tools serve as the operational core of modern Data Observability Platforms.
Data Observability relies on five foundational pillars to monitor health across enterprise data systems:
                     +-----------------------------------+
                     | FIVE PILLARS OF DATA OBSERVABILITY|
                     +-----------------------------------+
                                       |
       +-----------------+-------------+-------------+-----------------+
       |                 |                           |                 |
       v                 v                           v                 v
 [ FRESHNESS ]      [ VOLUME ]                  [ SCHEMA ]       [ QUALITY ]
 (Is data updated  (Did row counts             (Did table structure  (Are data values
    on time?)        drop/spike?)                 change?)            accurate?)
                                       |
                                       v
                                  [ LINEAGE ]
                     (How are upstream & downstream assets connected?)
Event correlation tools enhance these five pillars by linking telemetry signals into a clear operational view:
- Freshness & Volume Integration: If data freshness lags while ingestion volume drops, the correlation engine checks infrastructure logs to verify whether a network outage or source system bottleneck caused the delay.
- Schema Drift & Lineage Mapping: When schema changes occur, the correlation engine uses column-level data lineage to map downstream impact across analytical models and reports.
- Quality & Performance Alignment: Links data validation failures (such as high null value rates) to specific code deployments or transformation scripts, accelerating resolution.
Integration with ETL/ELT Pipelines, Cloud Platforms, and MLOps
Event correlation tools must integrate cleanly across every layer of the modern data ecosystem to maintain end-to-end operational visibility.
+----------------------------------------------------------------------------------+
|                           ECOSYSTEM INTEGRATION MAP                              |
|                                                                                  |
|  [ Ingestion & ETL/ELT ]   --> Airflow, Dagster, Fivetran, dbt, Spark           |
|  [ Cloud Platforms ]       --> AWS, Azure, Google Cloud, Snowflake, Databricks    |
|  [ MLOps Stack ]           --> MLflow, Kubeflow, Feast, Feature Stores           |
|  [ Observability Engine ]  --> Event Correlation & Root Cause Analysis           |
|  [ Communication Layer ]   --> PagerDuty, Slack, Jira, ServiceNow                |
+----------------------------------------------------------------------------------+
1. ETL/ELT Pipeline Orchestration
Connects natively with orchestration engines like Apache Airflow, Dagster, Prefect, Fivetran, and dbt. Captures task status events, retries, and execution logs in real time to trace task dependencies across complex execution graphs.
2. Cloud Data Platforms & Warehouses
Integrates via native APIs with platforms such as Snowflake, Databricks, Google BigQuery, AWS Redshift, and Azure Synapse. Monitors query execution times, resource utilization, warehouse credit usage, and storage event logs.
3. MLOps Environments
Extends visibility into machine learning lifecycle workflows by monitoring model feature stores, training data ingestion pipelines, and MLflow or Kubeflow pipeline executions. Correlates feature store data drift alerts with upstream ETL pipeline anomalies to ensure machine learning models receive high-quality training inputs.
Popular Event Correlation Tools for DataOps
The following comparison details leading event correlation and observability tools used across modern DataOps environments:
| Tool / Platform | Key Features | Integrations | Scalability | Primary Use Cases |
| Databand (by IBM) | Automated pipeline monitoring, metadata tracking, run-history baselines, and execution error grouping. | Apache Airflow, Spark, dbt, Snowflake, Python, Java. | Enterprise-grade; handles millions of daily pipeline events. | Data pipeline execution monitoring, SLA enforcement, and DataOps alerting. |
| Monte Carlo | End-to-end data observability, automated ML anomaly detection, column-level lineage, and incident clustering. | Snowflake, Databricks, BigQuery, dbt, Airflow, Looker, Tableau. | Enterprise-ready; highly scalable across multi-cloud data lakes. | Data downtime reduction, schema drift tracking, and automated root cause analysis. |
| Acceldata | Multi-plane observability (Data, Pipeline, Infrastructure), compute performance tuning, and cost tracking. | Hadoop, Spark, Kafka, Snowflake, Databricks, AWS, Azure. | High; optimized for complex hybrid-cloud data platforms. | Large-scale enterprise DataOps, performance optimization, and lakehouse monitoring. |
| PagerDuty (AIOps) | Machine learning alert correlation, noise reduction, intelligent event grouping, and incident routing. | Datadog, Airflow, CloudWatch, Prometheus, Slack, ServiceNow. | Scalable across global enterprise operational ecosystems. | Enterprise operational incident routing, alert noise reduction, and on-call response. |
| Datadog Data Observability | Unified log analytics, distributed tracing, infrastructure metrics, and automated correlation logic. | AWS, GCP, Azure, Kubernetes, Airflow, Snowflake, dbt. | Highly scalable cloud-native SaaS infrastructure. | Full-stack operational monitoring bridging DevOps, SRE, and DataOps teams. |
| Bigeye | Automated data quality metrics, ML anomaly thresholds, dependency mapping, and data health summaries. | Snowflake, BigQuery, Redshift, Databricks, dbt, Airflow. | High scalability for enterprise cloud data warehouses. | Automated data quality monitoring, SLA tracking, and lineage-based incident correlation. |
Real-World Enterprise Use Cases
Use Case 1: Financial Services – High-Frequency Transaction Ingestion
- Challenge: A global financial institution processes millions of transaction events per hour through Apache Kafka and Spark into a cloud data warehouse. Intermittent network latency led to out-of-order data processing and downstream reporting errors.
- Solution: The organization deployed an automated event correlation engine to monitor streaming metrics, ingestion logs, and warehouse load events simultaneously.
- Result: The correlation tool detected early network buffer retries, grouped related pipeline warnings into a single operational incident, and paused downstream settlement jobs before inaccurate balances reached reporting dashboards.
Use Case 2: E-Commerce – Schema Drift During Platform Migration
- Challenge: An e-commerce enterprise migrated its transactional database. Software developers added new columns and renamed existing checkout fields without notifying the data engineering team, breaking nightly ELT jobs.
- Solution: An AI-powered event correlation platform monitored data ingestion logs alongside dbt transformation outputs.
- Result: The system identified the exact schema drift origin in the source database, mapped the downstream impact using column lineage, and alerted the DataOps team within minutes—reducing investigation time from 6 hours to under 15 minutes.
Business Benefits of Event Correlation
Implementing event correlation tools within a DataOps framework delivers measurable operational and financial returns:
+--------------------------------------------------------------------+
|                BUSINESS BENEFITS OF EVENT CORRELATION              |
+--------------------------------------------------------------------+
|                                                                    |
|  [ Reduced Data Downtime ]  --> Ensures high data availability     |
|  [ Operational Savings ]   --> Minimizes manual engineering hours  |
|  [ Improved SLA Adherence ] --> Protects downstream analytics trust |
|  [ Lower Alert Fatigue ]    --> Keeps DataOps teams focused        |
|                                                                    |
+--------------------------------------------------------------------+
- Reduced Data Downtime: Minimizes data downtime by identifying pipeline anomalies rapidly and stopping the propagation of corrupted data.
- Lower Engineering Operational Costs: Saves engineering time previously spent manually hunting for broken code, permitting data teams to focus on revenue-generating data products.
- Improved Service Level Agreement (SLA) Compliance: Helps data teams meet strict internal and customer SLAs for data delivery freshness and accuracy.
- Enhanced Data Trust across the Enterprise: Business executives, analytics teams, and data scientists gain confidence in dashboard metrics and AI/ML model outputs, knowing pipelines are monitored by automated operational controls.
Common Challenges and Limitations
While event correlation tools provide significant value, data teams may encounter operational challenges during deployment:
- Data Silos and Integration Gaps: Legacy data tools, custom internal scripts, or proprietary databases may lack native API connectors, requiring custom log parsers to collect telemetry events.
- Initial Alert Threshold Calibration: Machine learning baselines require time to learn normal pipeline patterns. Early deployment phases can generate false positives if threshold sensitivity is not tuned correctly.
- Complex Data Lineage Dependencies: Building accurate end-to-end data lineage across multi-cloud environments, transformation layers, and business dashboards requires clean metadata standards.
- Organizational Resistance: Transitioning engineering teams from traditional manual log investigation to automated event correlation requires culture shifts, clear operational workflows, and team training.
Best Practices for Successful Implementation
To maximize the value of event correlation tools in your DataOps environment, apply these practical recommendations:
Implementation Checklist
- [ ] Standardize Logging Formats: Ensure all custom data scripts, transformation models, and pipeline orchestrators output logs in structured formats (e.g., JSON) with consistent timestamp fields.
- [ ] Map End-to-End Data Lineage: Establish column-level and table-level lineage tracking across ingestion, transformation, and reporting layers before configuring correlation logic.
- [ ] Start with Core High-Priority Pipelines: Begin by implementing event correlation on critical pipelines that support key business dashboards and operational machine learning models.
- [ ] Fine-Tune Noise Reduction Rules: Continuously adjust alert aggregation windows and suppression policies to keep notifications focused and actionable.
- [ ] Establish Automated Recovery Actions: Integrate correlation outputs directly with orchestration engines to automate routine self-healing tasks, such as triggering retries or pausing downstream jobs upon upstream failure.
Common Mistakes Organizations Should Avoid
- Mistake 1: Treating Event Correlation as a Replacement for Data Testing: Event correlation monitors pipeline behavior and operational events; it does not eliminate the need for upfront data unit testing and schema validation.
- Mistake 2: Ignoring Log Standardization: Sending unformatted text logs into a correlation engine degrades parsing efficiency and reduces root cause detection accuracy.
- Mistake 3: Over-Configuring Static Rules: Relying entirely on manual, static IF/THEN rules creates high maintenance overhead as your cloud data stack expands. Combine rule-based logic with ML anomaly detection.
- Mistake 4: Routing Alerts to General Channels: Broadcasting all incident notifications to large, generic team channels leads to alert fatigue. Direct targeted alerts to specific on-call engineers via integrated incident management tools.
Future Trends in AI-Driven Event Correlation
As enterprise data architectures evolve, event correlation tools are integrating advanced artificial intelligence capabilities:
- Generative AI Root Cause Explanations: Next-generation correlation platforms use Large Language Models (LLMs) to analyze raw error logs, query execution histories, and code changes, delivering natural-language summaries of root cause incidents alongside code fix recommendations.
- Autonomous Pipeline Self-Healing: Future DataOps environments will go beyond flagging issues. Systems will independently fix common operational errors—such as dynamically re-allocating cloud compute resources, adjusting execution schedules, or rewriting broken query logic automatically.
- Cross-Domain Observability Integration: Merging traditional IT Infrastructure Observability (DevOps/SRE) with Data Observability (DataOps) to create a single operational view across systems, network layers, database engines, and business reporting tools.
Skills Required for Modern DataOps Engineers
Engineers building and maintaining automated event correlation systems benefit from developing skills across several core domains:
+---------------------------------------------------------------------------------+
|                        DATAOPS ENGINEER SKILLS MATRIX                           |
+---------------------------------------------------------------------------------+
|                                                                                 |
|  [ Core Pipeline Tooling ]    --> Airflow, Dagster, dbt, Spark, Fivetran         |
|  [ Cloud Platforms ]          --> Snowflake, Databricks, BigQuery, AWS, Azure    |
|  [ Telemetry & Observability ]--> Datadog, Databand, Monte Carlo, OpenTelemetry   |
|  [ Scripting & Automation ]   --> Python, SQL, Bash, Terraform, CI/CD           |
|  [ Incident Management ]      --> PagerDuty, Jira, Data Lineage Mapping          |
|                                                                                 |
+---------------------------------------------------------------------------------+
- Pipeline Orchestration Mastery: Deep practical knowledge of modern orchestration tools (Airflow, Dagster, Prefect) and transformation frameworks (dbt).
- Data Observability & Telemetry Frameworks: Proficiency with telemetry standards (OpenTelemetry), log management, data quality frameworks, and metadata extraction APIs.
- Cloud Infrastructure & SQL Optimization: Understanding cloud data warehouse architectures, compute scaling models, and query plan execution across systems like Snowflake, Databricks, and BigQuery.
- Automation and CI/CD: Expertise in writing infrastructure-as-code scripts, deployment pipelines, and automated test suites to support resilient data engineering operations.
Frequently Asked Questions
What is an event correlation tool in DataOps?
An event correlation tool in DataOps is a specialized software platform that ingests, processes, and analyzes operational signals—such as error logs, performance metrics, and pipeline status updates—from across your data ecosystem. It groups related signals together, eliminates redundant alert noise, and isolates the root cause of pipeline failures automatically.
How does event correlation reduce alert noise?
Event correlation engines use time-windowing algorithms, semantic clustering, and data lineage mapping to merge repeated notifications and silence downstream symptom alerts. Instead of sending dozens of separate error messages when an upstream database fails, the tool generates a single incident summary pointing to the root cause.
What is the difference between data monitoring and event correlation?
Traditional data monitoring checks isolated metrics or individual job statuses against static thresholds and sends alerts whenever a check fails. Event correlation analyzes relationships across multiple events, systems, and timeframes to connect individual error logs with system dependencies, pinpointing exact root causes.
Can event correlation tools work with legacy data pipelines?
Yes. Most enterprise event correlation engines provide flexible integration options, including REST APIs, custom log parsers, database agents, and OpenTelemetry collectors. This allows them to ingest log events from legacy databases and custom batch scripts alongside modern cloud platforms.
How does machine learning improve event correlation?
Machine learning enables correlation engines to learn baseline performance patterns automatically across data pipelines. Rather than relying solely on manually configured rules, ML algorithms detect subtle anomalies, identify complex event relationships, and discover novel failure modes as data architectures scale.
Why is data lineage important for event correlation?
Data lineage maps the flow of data from source databases through ingestion jobs and transformation models down to final business dashboards. Event correlation tools leverage this lineage map to track how upstream failures impact downstream assets, allowing them to suppress redundant downstream alerts and isolate the initial point of failure.
What is Mean Time to Resolution (MTTR), and how does event correlation improve it?
Mean Time to Resolution (MTTR) is the average time required for an engineering team to diagnose and resolve an operational system failure. Event correlation dramatically reduces MTTR by eliminating manual log searching and surfacing the probable root cause of an incident automatically within minutes.
Does event correlation replace data quality testing frameworks?
No. Data quality testing frameworks (like Soda or Great Expectations) validate data values against business rules at specific pipeline checkpoints. Event correlation tools complement testing frameworks by monitoring overall pipeline behavior, infrastructure telemetry, and execution events to contextualize test failures within system-wide workflows.
How do event correlation tools integrate with PagerDuty and Slack?
Event correlation engines connect with notification and incident management platforms via webhooks and native APIs. When the correlation engine identifies a high-severity root cause incident, it creates an incident ticket, attaches diagnostic context, and routes it directly to on-call data engineers via PagerDuty, Slack, or ServiceNow.
Are event correlation tools difficult to set up in cloud environments?
Modern cloud-native event correlation platforms offer pre-built connectors for popular data warehouses (Snowflake, BigQuery), orchestration tools (Airflow, Dagster), and transformation frameworks (dbt). Initial setup can often be completed in a few days, though fine-tuning ML anomaly baselines and alert suppression policies typically takes a few weeks of operational observation.
Conclusion
As enterprise data architectures grow more distributed, maintaining data availability and pipeline reliability requires moving beyond isolated, reactive monitoring tools. Data engineering teams can no longer afford to spend manual hours sifting through noisy log files whenever a pipeline fails or an executive report breaks. Event correlation tools provide the visibility, automation, and noise reduction modern DataOps teams need to maintain resilient data pipelines. By ingesting telemetry across logs, metrics, traces, and data observability checks, these engines convert disjointed system noise into actionable operational context. They eliminate alert fatigue, shorten Mean Time to Resolution (MTTR), protect data lineage integrity, and ensure clean, reliable data reaches downstream consumers continuously.
