Data visualization tools are software applications or platforms that enable users to create visual representations of data sets. These visualizations help transform complex data into more understandable and insightful formats, such as charts, graphs, maps, and dashboards. The goal of data visualization is to make it easier for individuals, regardless of their technical background, to interpret and analyze data, identify patterns, trends, and relationships, and make informed decisions based on the insights gained from the visual representations.
We’ll explore five prominent data visualization tools:-
- Tableau
- Microsoft Power BI
- QlikView
- SAP Lumira
- TIBCO Spotfire
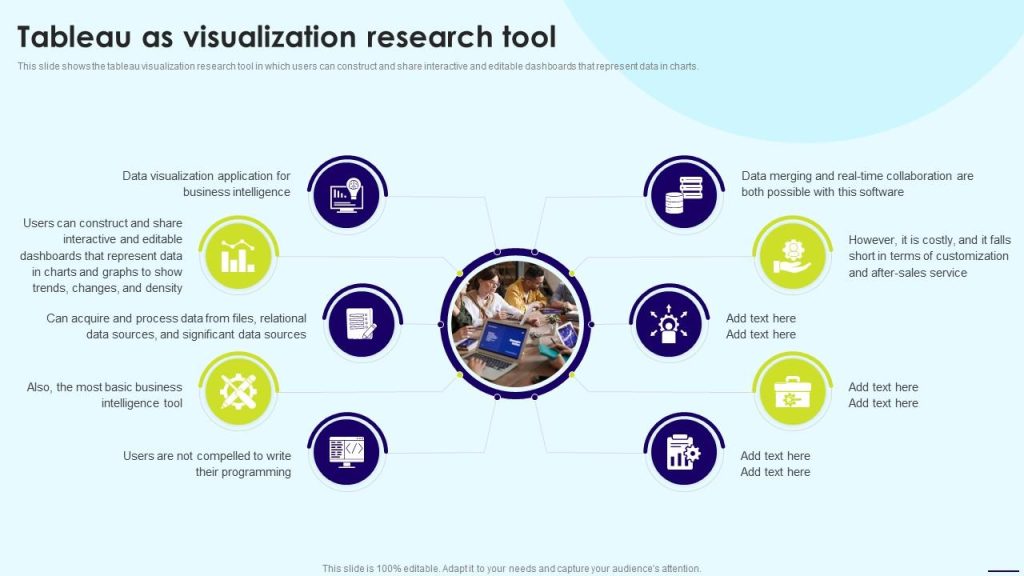
Tableau
Tableau is a powerful and intuitive data visualization tool used by businesses of all sizes. With its drag-and-drop interface, Tableau allows users to create interactive dashboards, charts, and graphs without the need for coding. It offers a wide range of visualization options and supports various data sources, making it a versatile tool for data analysis.
Microsoft Power BI
Microsoft Power BI is another popular data visualization tool that enables users to transform raw data into interactive visuals and reports. With its integration with other Microsoft products, Power BI offers seamless data connectivity, making it easy to access and analyze data from multiple sources. It also provides advanced analytics capabilities and AI-powered insights.
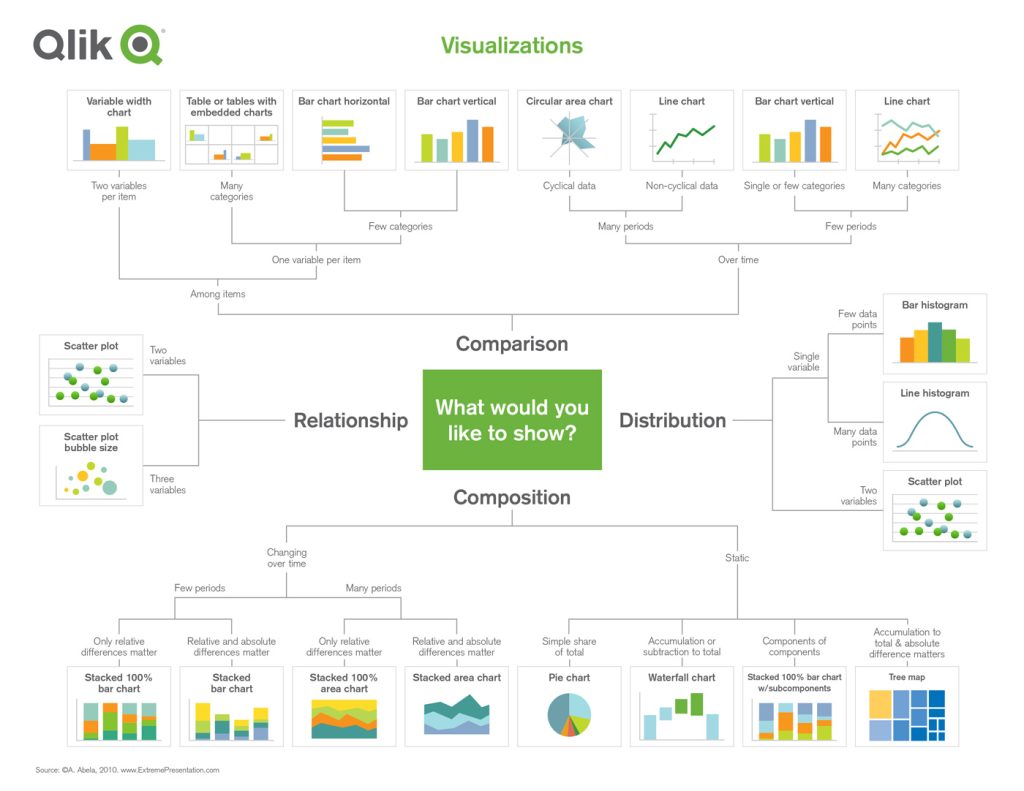
QlikView
QlikView is a self-service business intelligence and data visualization tool known for its associative data model. It allows users to explore data freely, without predefined paths or queries. QlikView’s in-memory technology enables fast data processing and real-time visualizations, empowering users to make data-driven decisions quickly.
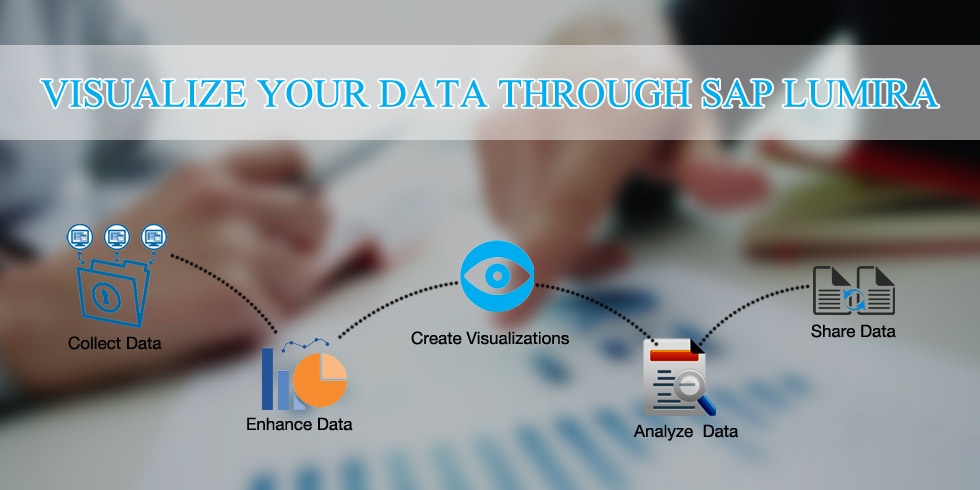
SAP Lumira
SAP Lumira is a data visualization tool that helps users create interactive dashboards and visualizations from various data sources. It offers a user-friendly interface and a wide range of chart types and visualization options. With Lumira, users can combine multiple data sets and perform advanced data manipulation and analysis.
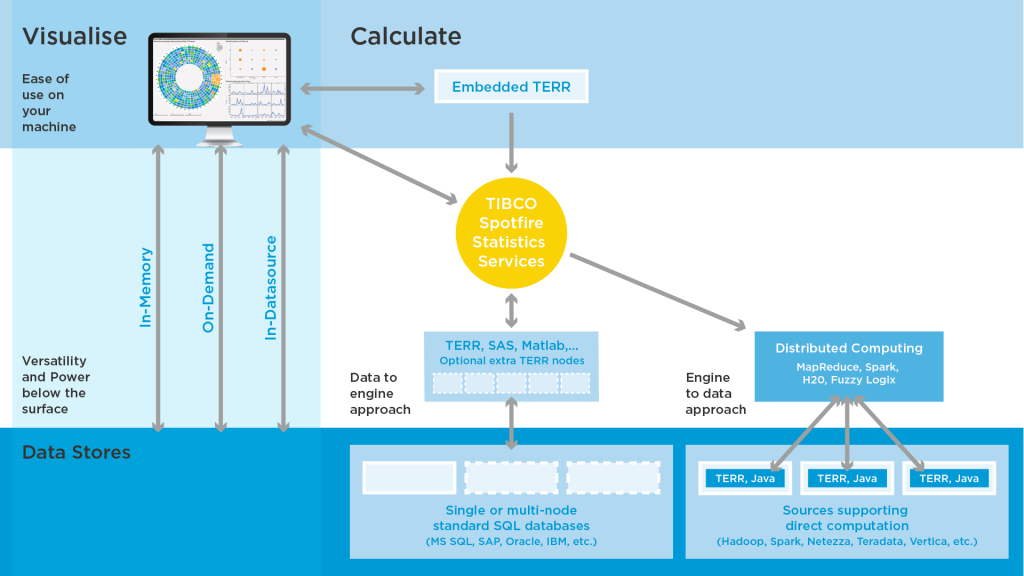
TIBCO Spotfire
TIBCO Spotfire is a comprehensive data visualization and analytics platform that offers advanced data discovery and exploration capabilities. It provides interactive dashboards, predictive analytics, and real-time data visualization. Spotfire’s powerful data wrangling features make it easy to clean and transform data for accurate analysis.
Conclusion
Data visualization tools are essential for businesses and individuals alike to make sense of complex data and gain valuable insights. Tableau, Microsoft Power BI, QlikView, SAP Lumira, and TIBCO Spotfire are just a few examples of the many powerful tools available in the market. Each tool has its own unique features and strengths, so it’s important to choose the one that best suits your specific needs and requirements.