Are you looking to create a DataOps dashboard but aren’t sure where to start? Fear not, because in this article, we will guide you through the process step-by-step.
What is DataOps?
Before we dive into the specifics of building a DataOps dashboard, let’s first define what DataOps is. DataOps is a methodology that combines Agile and DevOps principles to manage and deliver data-driven applications. The goal of DataOps is to improve the speed, quality, and reliability of data analytics by streamlining the entire data lifecycle.
Why Build a DataOps Dashboard?
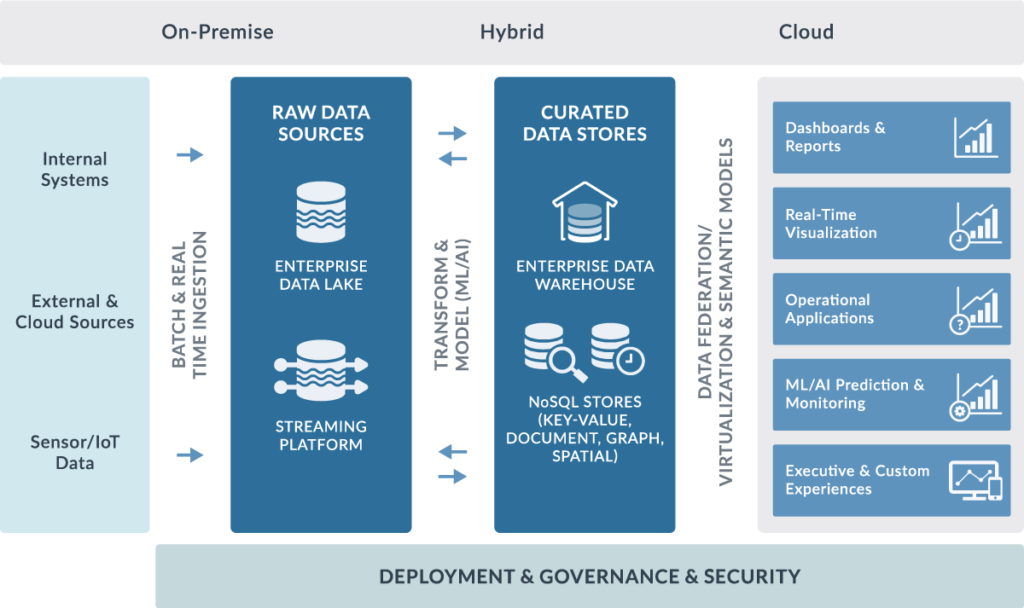
A DataOps dashboard provides a visual representation of your data pipeline, making it easier to monitor and manage your data. With a dashboard, you can quickly identify any issues or bottlenecks in your pipeline and take action to resolve them.
Step-by-Step Guide to Building a DataOps Dashboard
Step 1: Define Your Metrics
The first step in building a DataOps dashboard is to define the metrics you want to track. These metrics should be specific to your organization’s data pipeline and should align with your business goals.
Step 2: Choose Your Dashboard Platform
There are many dashboard platforms available, each with its own set of features and benefits. Some popular options include Tableau, Power BI, and Looker. Consider your budget, technical expertise, and the features you require when choosing a platform.
Step 3: Connect Your Data Sources
Once you’ve chosen your dashboard platform, you’ll need to connect your data sources. This can include databases, data warehouses, and APIs. Make sure to test your connections thoroughly to ensure that your data is being pulled correctly.
Step 4: Design Your Dashboard
Now it’s time to design your dashboard. Use your metrics as a guide to determine what data to include and how to visualize it. Keep in mind that your dashboard should be easy to read and understand at a glance.
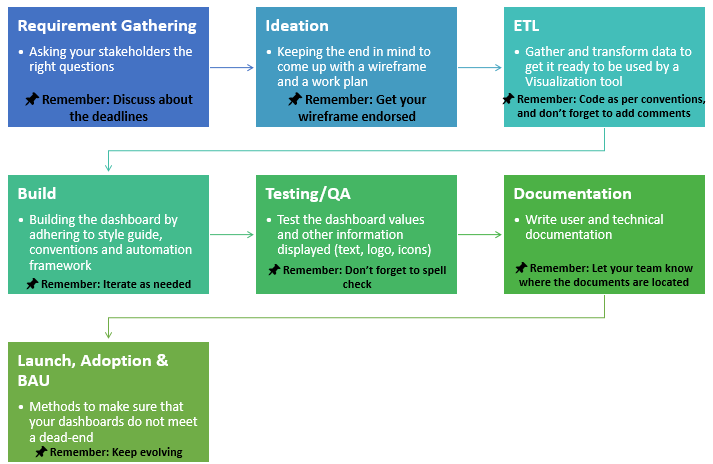
Step 5: Test and Refine Your Dashboard
Before sharing your dashboard with your team, make sure to test it thoroughly. Look for any errors or inconsistencies in your data and refine your design as needed.
Conclusion
Building a DataOps dashboard can seem overwhelming at first, but by following these steps, you can create a dashboard that will help you manage and optimize your data pipeline. Remember to keep your metrics in mind, choose the right platform, and design a dashboard that is easy to understand. With a DataOps dashboard, you’ll be able to make data-driven decisions quickly and efficiently.