Introduction
Picture this scenario: An analyst arrives at work, opens a key executive dashboard, and discovers the numbers are completely outdated because a scheduled data extract failed silently overnight. When steps like ingestion, transformation, and validation are handled manually, data teams frequently face delayed data, broken pipelines, repetitive tasks, and stale dashboards that erode business trust. TheDataOps.org explains that DataOps applies automation, collaboration, Agile practices, and DevOps principles across the data lifecycle to make analytics delivery faster and more reliable. At its core, analytics pipeline automation is not simply about scheduling jobs, but about making data delivery repeatable, testable, observable, and easier to operate through platforms like TheDataOps.org.
What Is an Analytics Pipeline?
An analytics pipeline is simply a sequence of processes that moves, transforms, validates, and delivers data reliably and repeatedly. It acts as the digital assembly line connecting raw information originating from various business systems to the decision-makers who need clear insights.
Data typically flows through a structured path:
CRM / ERP / APIs / Applications
              ↓
          Data Ingestion
              ↓
       Raw Data Storage
              ↓
       Transformation
              ↓
        Data Validation
              ↓
      Curated Data Layer
              ↓
      Analytics / BI / ML
              ↓
       Business Decisions
Every single step in this sequence requires careful handling. Without a structured pipeline, data remains trapped in isolated source systems, making comprehensive reporting nearly impossible.
When well-designed, a pipeline ensures information flows smoothly, accurately, and securely from its origin to your favorite business intelligence tool.
What Is Automation in Analytics Pipelines?
Analytics pipeline automation refers to the use of software and systems to execute repetitive data workflows with limited manual intervention. Instead of humans triggering scripts or checking files by hand, intelligent systems handle routine tasks seamlessly.
Automation covers a wide range of activities across the data lifecycle, including:
- Data ingestion from external systems
- Job scheduling and dependency management
- Data transformation and cleansing
- Data validation and quality checks
- Code deployment across environments
- Continuous monitoring and alerting
- Retry handling for transient errors
- Documentation and operational reporting
It is important to clarify that automation does not mean removing humans completely.
Human oversight remains vital for defining business rules, establishing governance policies, handling unexpected incidents, and designing architectural changes. Automation takes care of repetitive operational toil, freeing engineers and analysts to focus on high-value problem-solving.
Why Manual Analytics Pipelines Become Difficult
When organizations start out, manual analytics workflows often seem manageable. A few simple scripts pull data into a spreadsheet or local database, and reports are updated by hand. However, as data volumes grow and business demands increase, these manual approaches quickly break down.
Common operational pitfalls include:
- Manual Data Extraction: Team members repeatedly download CSV files or write ad-hoc scripts to pull data from various SaaS platforms.
- Manual Validation: Analysts discover bad data only after reports have already been distributed to leadership.
- Manual Deployment: New SQL models or dashboard updates are copied between development and production environments by hand, risking human error.
- Manual Monitoring: Someone has to constantly check whether morning jobs completed successfully or if a process stalled overnight.
- Manual Troubleshooting: Engineers spend hours digging through logs to figure out exactly where a pipeline failed.
- Siloed Workflows: Data engineers, analytics engineers, and business stakeholders operate with completely different processes and communication gaps.
Automation reduces this repetitive work and makes pipeline execution consistent, repeatable, and resilient against everyday disruptions.
How DataOps Enables Analytics Automation
DataOps combines Agile principles, DevOps practices, collaboration, automation, continuous testing, monitoring, and quality management.
TheDataOps.org describes DataOps as a methodology that helps operationalize data management and integration while improving reliability and agility.
To achieve this, DataOps teams follow a continuous delivery lifecycle:
Develop → Test → Deploy → Monitor → Learn → Improve
TheDataOps.org’s recent guidance uses a similar operational lifecycle for managing data workflows. By treating data code with the same engineering rigor applied to traditional software development, organizations eliminate guesswork and build transparent, high-performing analytics teams.
Automated Data Ingestion
Automated data ingestion is the practice of collecting data from various source systems without manual extraction. Modern pipelines pull information continuously or on schedule from:
- Relational and NoSQL databases
- Third-party REST APIs
- SaaS applications and marketing platforms
- CRM and ERP systems
- IoT devices and event streams
Effective ingestion strategies utilize scheduled triggers, event-driven triggers, Change Data Capture (CDC) to capture only modified rows, incremental loading, and robust retry mechanisms. Automated ingestion removes reliance on manual exports, ensuring that downstream systems always receive fresh, complete data.
Automated Data Transformation
Raw data is rarely ready for immediate analysis. It often contains messy formatting, duplicate records, or unjoined tables. Automated data transformation converts this raw input into clean, usable analytical datasets.
Core transformation tasks include:
- Cleaning and standardizing text values
- Joining disparate tables together
- Filtering out test or irrelevant records
- Aggregating metrics for reporting
- Enriching data with reference tables
Tools such as dbt (data build tool) serve as popular development frameworks for managing transformations inside modern data warehouses. Version-controlled transformation logic stored in Git repositories is significantly easier to review, test, and maintain than scattered, undocumented manual SQL scripts.
Automated Data Quality Testing
Data quality should always be verified before information reaches user-facing dashboards. Waiting for business users to spot bad data destroys trust in analytics initiatives.
Automated checks can catch issues early by testing for:
- Unexpected null values in mandatory fields
- Duplicate records or transaction IDs
- Invalid data types or out-of-range numbers
- Abnormal row count fluctuations
- Primary-key uniqueness violations
- Accepted categorical values
- Data freshness and update delays
- Broken referential integrity between tables
TheDataOps.org’s recent analytics automation guidance specifically recommends embedding validation and testing throughout the pipeline rather than waiting until the final reporting layer.
Continuous Integration for Analytics
Continuous Integration (CI) is a software engineering practice where developers frequently merge code changes into a central repository, where automated builds and tests run.
In an analytics context, a typical CI workflow looks like this:
Developer changes SQL / Pipeline Code
              ↓
          Git Commit
              ↓
        Automated Tests
              ↓
       Quality Validation
              ↓
       Code Review / Merge
By running automated tests against pull requests before code is merged into production branches, CI helps catch broken queries, syntax errors, and breaking schema changes early in the development cycle.
Continuous Delivery and Deployment
Continuous Delivery and Deployment (CD) automates the release of tested code and pipeline assets from development environments through testing and staging, and finally into production.
Key elements of a robust CD setup include:
- Automated deployment scripts that eliminate manual copy-pasting
- Environment consistency across staging and production
- Approval gates for critical production releases
- Automated rollbacks if a deployment fails
- Clear version tracking for every artifact
TheDataOps.org’s material describes automated release pipelines and infrastructure-as-code mechanisms as essential for making analytics deployments repeatable and stress-free.
Workflow Orchestration
As pipelines grow beyond simple scripts, managing task order becomes complex. Workflow orchestration is the coordination layer that connects individual pipeline tasks and manages execution logic.
An orchestration system—such as Apache Airflow or Prefect—manages:
- Task dependencies and sequencing
- Execution schedules
- Automatic retries for failed tasks
- Failure handling and fallback routines
A typical orchestrated workflow follows a clear sequence:
Ingest Data
    ↓
Validate Data
    ↓
Transform Data
    ↓
Run Quality Tests
    ↓
Update Warehouse
    ↓
Refresh Dashboard
Orchestration prevents race conditions, ensuring that downstream transformations never run before upstream data ingestion has successfully completed.
Automated Scheduling
Automated scheduling allows pipelines to run according to specific business needs rather than manual triggers. Schedules can be configured to execute:
- Hourly, daily, or weekly intervals
- On-demand for specific projects
- Automatically when new source data arrives
- Immediately after upstream dependencies finish executing
Schedules should always reflect actual business freshness requirements, rather than simply running as frequently as possible, which wastes compute resources and inflates cloud bills.
Event-Driven Analytics Automation
While scheduled pipelines run on a fixed timetable, event-driven architectures react instantly to specific triggers. It is helpful to distinguish between the two approaches:
- Schedule-driven: “Run this customer aggregation pipeline every night at 2:00 AM.”
- Event-driven: “Run this workflow immediately when a new payment confirmation file arrives in cloud storage.”
Common event-driven triggers include new transaction events, file arrivals, database change notifications, streaming messages, and upstream pipeline completions. Event-driven architectures are especially useful for near-real-time analytics use cases.
Automated Monitoring
A pipeline that runs automatically but cannot be observed is an operational risk. Automated monitoring provides visibility into pipeline health by tracking:
- Pipeline success and failure rates
- Total execution duration and performance trends
- Data freshness and arrival times
- Row count anomalies and unexpected drops
- Schema changes in source systems
- Cloud compute resource usage
- Data quality scorecards
- Processing latency
TheDataOps.org’s AnalyticsOps guidance emphasizes observability through metrics, logs, tracing, and lineage to ensure teams understand the complete state of their data systems.
Automated Alerting
When something goes wrong, the right people need to know immediately. Automated alerting notifies teams via communication channels when specific thresholds are breached, such as:
- A critical pipeline failure occurs
- Expected data delivery is late
- Automated quality checks fail
- Source schemas change unexpectedly
- Processing takes significantly longer than normal
- Cloud spending exceeds defined thresholds
Alert quality is critical. Avoid configuring pipelines to generate an alert for every minor event, as “alert fatigue” causes teams to ignore genuine warnings. Focus alerts on actionable failures that impact business operations.
Automated Retry and Recovery
Data pipelines frequently interact with external systems over networks, making them susceptible to transient errors. Common failure scenarios include:
- Temporary API rate limits or downtime
- Network timeouts
- Database connection drops
- Temporary compute resource shortages
Automated retry mechanisms can recover gracefully from these temporary glitches without requiring human intervention. However, developers must configure retry limits carefully. Unlimited retries are dangerous because they can inflate cloud costs, hide underlying infrastructure problems, and create duplicate processing loops.
Automated Schema Change Detection
Upstream systems change over time. For example, a customer table might evolve from this initial schema:
Customer_ID
Customer_Name
Email
To this updated schema:
Customer_ID
Customer_Name
Email
Phone
Automated schema checks detect unexpected column additions, deletions, or data type changes before they silently break downstream models, reports, and dashboards.
Automated Lineage
Data lineage maps the journey of data across your organization. Automated lineage tracks:
Where data came from→What happened to it→Where it is used
For example:
CRM→Raw Table→Transformation→Analytics Model→Dashboard
Automated lineage makes troubleshooting faster, enables precise impact analysis before making schema changes, improves data governance, and builds trust among business stakeholders.
Automation and Collaboration
Automation improves collaboration between data engineers, analytics engineers, data scientists, BI developers, and business analysts. By adopting shared practices such as Git version control, code reviews, common quality standards, automated tests, and shared documentation, teams break down traditional organizational silos.
TheDataOps.org emphasizes breaking down barriers between data producers and consumers as a core objective of successful DataOps adoption.
Automation Across the Analytics Lifecycle
| Stage | Automation Example |
|---|---|
| Data Collection | Scheduled and API-driven ingestion |
| Ingestion | Automated bulk and incremental loading |
| Validation | Pre-transformation quality checks |
| Transformation | Version-controlled SQL models |
| Testing | Automated regression and unit tests |
| Deployment | Continuous Integration and Delivery (CI/CD) |
| Orchestration | Dependency-based workflow execution |
| Monitoring | Pipeline health and freshness checks |
| Alerting | Failure notifications and threshold warnings |
| Analytics | Automated BI model and dataset refreshes |
| Documentation | Automatically generated data catalogs |
| Governance | Automated policy and access checks |
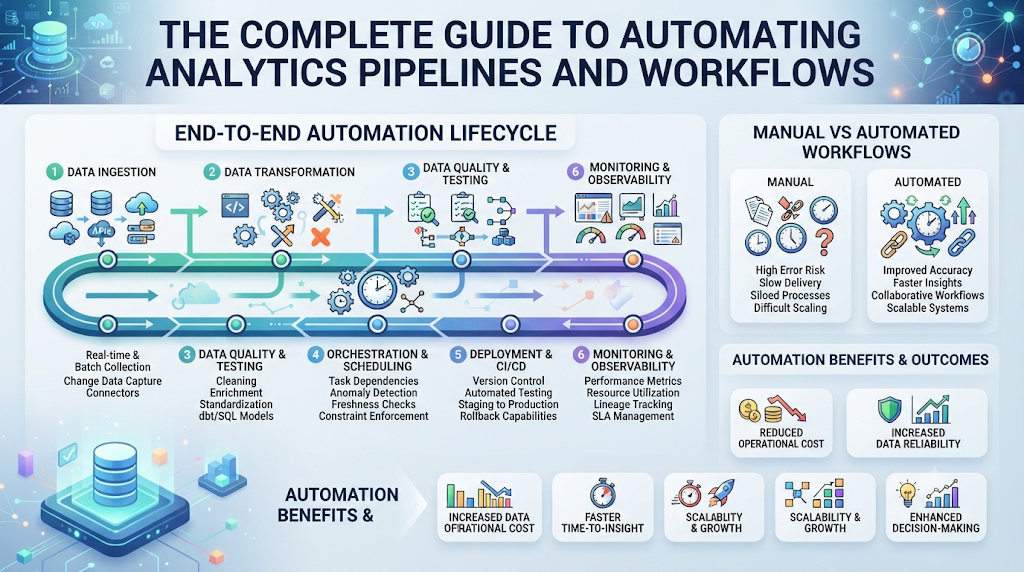
Traditional vs Automated Analytics Pipelines
| Traditional Pipeline | Automated DataOps Pipeline |
|---|---|
| Manual execution and triggers | Automated, scheduled workflows |
| Manual testing and spot checks | Continuous, automated validation |
| Manual code deployment | Automated CI/CD release pipelines |
| Reactive monitoring | Continuous, proactive monitoring |
| Siloed processes and teams | Collaborative, cross-functional workflows |
| Difficult and risky rollbacks | Version-controlled, safe rollbacks |
| Slow delivery cycles | Repeatable, fast delivery |
| High manual maintenance effort | Reduced repetitive operational toil |
Automation does not automatically make a pipeline reliable. Poorly designed automation simply scales up bad processes and creates faster failures. Sound architectural design must come first.
Tools Used in Analytics Pipeline Automation
Modern tool ecosystems are categorized by function rather than relying on one monolithic platform:
- Orchestration: Apache Airflow, Prefect, Dagster
- Transformation: dbt (data build tool)
- Data Ingestion: Fivetran, Airbyte, Singer
- Streaming: Apache Kafka, Apache Flink
- Data Quality: Great Expectations, Soda, Monte Carlo
- Version Control: Git, GitHub, GitLab
- Business Intelligence: Power BI, Tableau, Looker
TheDataOps.org’s guide presents an ecosystem combining orchestration, transformation, validation, streaming, and BI technologies rather than relying on a single vendor solution.
Choosing the Right Automation Tools
Selecting the right automation tools requires evaluating several practical criteria:
- Pipeline complexity and data volume requirements
- Business freshness and latency expectations
- Current team skills and engineering bandwidth
- Existing cloud environment and security standards
- Total cost of ownership and maintenance overhead
Always choose your architecture first and your tools second. Match technology choices to your team’s specific capabilities and organizational maturity.
Automation for Batch Analytics
Batch automation handles heavy workloads that do not require millisecond latency. Common use cases include daily executive reports, financial reconciliations, customer segmentation models, inventory reporting, and scheduled machine learning feature tables.
Robust batch automation relies on strict scheduling, clear dependency handling, pre-execution validation checks, and proactive failure notifications.
Automation for Real-Time Analytics
Real-time analytics pipelines use streaming architectures to support use cases like fraud detection, operational monitoring, IoT telemetry, real-time dashboards, and customer personalization.
These systems rely heavily on event streams and streaming processors. However, real-time automation introduces unique complexities, including message ordering, late-arriving data handling, duplicate prevention, state management, and strict processing guarantees.
Automation and Data Quality
An effective data quality framework follows a clear lifecycle:
Detect→Validate→Quarantine→Notify→Correct→Reprocess
Invalid records should never automatically flow into trusted analytical datasets. Teams should use data contracts, automated validation gates, and quarantine zones to isolate bad data before it affects reporting.
TheDataOps.org’s enterprise guidance describes automated validation gates for constraints such as row counts, null values, uniqueness, and data types.
Automation and Governance
Automation supports robust data governance by enforcing role-based access control, managing secrets securely, maintaining audit trails, automating data retention policies, and handling sensitive data masking.
Governance should be embedded directly into pipeline workflows rather than treated as a manual review performed after code deployment.
Automation and Cost Management
While automation reduces manual labor, poorly designed pipelines can quickly inflate cloud computing bills. Common cost traps include excessive pipeline scheduling frequencies, unnecessary retries, inefficient queries, over-provisioned cluster compute, and reprocessing massive datasets without incremental logic.
Cost monitoring and optimization should be treated as core components of overall pipeline observability.
Common Challenges in Analytics Automation
Adopting pipeline automation comes with several common hurdles:
- Poor Data Quality: Bad source inputs move through automated pipelines faster, magnifying data errors if validation gates are missing.
- Legacy Systems: Older on-premise systems often lack modern APIs, webhooks, or automation hooks.
- Integration Complexity: Combining too many specialized tools can create brittle dependencies.
- Skill Gaps: Teams may need training in software engineering best practices, Git workflows, and DevOps principles.
- Governance Risks: Automation can accidentally expand data access if security permissions are misconfigured.
- Over-Automation: Trying to automate every minor exception adds unnecessary complexity.
TheDataOps.org identifies these challenges as common stepping stones in enterprise DataOps adoption, noting that overcoming them requires cultural alignment alongside technical tooling.
How to Implement Analytics Pipeline Automation
Organizations can implement automation successfully by following a practical, step-by-step roadmap:
- Map the Current Pipeline: Document all data sources, transformations, dependencies, and business consumers.
- Identify Manual Tasks: Find repetitive activities causing delays or human errors.
- Define Quality Rules: Establish what makes data accurate and trustworthy for your stakeholders.
- Introduce Version Control: Store all pipeline and transformation code in Git repositories.
- Add Orchestration: Implement an orchestrator to manage scheduling and task dependencies.
- Add Automated Testing: Test data transformations and quality constraints continuously.
- Add CI/CD: Automate code validation, testing, and deployment across environments.
- Add Monitoring: Track pipeline health, execution duration, and data freshness.
- Add Alerting: Configure notifications for the right team members when critical failures occur.
- Improve Continuously: Use operational metrics and incident reviews to refine your automation workflows.
Practical Example
Consider an e-commerce analytics pipeline processing daily retail sales:
Online Store
     ↓
Transaction Data
     ↓
Automated Ingestion
     ↓
Quality Checks
     ↓
Transformation
     ↓
Analytics Warehouse
     ↓
Dashboard
When new transaction data arrives, the following automated steps execute seamlessly:
- The ingestion process loads new records from the store database.
- Automated validation checks run against the incoming rows.
- Invalid or corrupt records are isolated in a quarantine zone.
- Transformation jobs clean, join, and aggregate the clean data.
- Curated analytics tables are updated in the warehouse.
- BI dashboards refresh automatically for morning users.
- Monitoring tools verify pipeline health and log execution metrics.
- Alerts trigger immediately if any critical step fails.
How TheDataOps.org Explains Analytics Automation
TheDataOps.org approaches automation as part of a broader DataOps lifecycle rather than treating it as simple task scheduling. Key pillars include:
- Automation: Reducing repetitive manual work across data delivery.
- Quality: Embedding automated validation and testing directly into pipelines.
- Collaboration: Using shared workflows, version control, and engineering standards.
- Orchestration: Coordinating complex dependencies between pipeline stages.
- Observability: Monitoring pipeline execution, freshness, lineage, and data quality.
- Continuous Improvement: Using operational feedback to boost reliability.
TheDataOps.org’s recent AnalyticsOps guidance explicitly describes automation-first practices, automated tests, CI/CD, observability, lineage, and automated remediation as essential parts of an operational analytics lifecycle.
Automation Maturity Model
Organizations typically progress through four stages of automation maturity:
- Level 1 — Manual: Human-triggered jobs, local scripts, and manual validation.
- Level 2 — Scheduled: Automated scheduling with basic email alerts and minimal monitoring.
- Level 3 — Integrated: Full orchestration, automated testing, CI/CD pipelines, and active monitoring.
- Level 4 — Intelligent: Predictive monitoring, automated remediation, advanced lineage, and automated governance.
Organizations should move through these levels gradually, building a solid foundation before attempting advanced automation.
KPIs for Measuring Automation Success
| KPI | What It Measures |
|---|---|
| Pipeline Success Rate | Overall workflow reliability |
| Data Freshness | Timeliness of delivered insights |
| Pipeline Duration | Processing efficiency and performance |
| Failure Rate | Operational stability over time |
| MTTR (Mean Time to Recovery) | Incident response speed |
| Manual Intervention Rate | Effectiveness of workflow automation |
| Data Defect Rate | Quality of delivered data products |
| Deployment Frequency | Speed of analytics delivery |
| Rollback Rate | Deployment stability and confidence |
| Cloud Cost per Pipeline | Financial efficiency and optimization |
Automation success should be measured through tangible business and operational outcomes, not simply by counting the number of automated tasks.
Security and Responsible Automation
Automated pipelines frequently handle sensitive customer and financial data, making robust security controls essential. Best practices include enforcing least-privilege access, managing credentials securely with dedicated secrets managers, encrypting data at rest and in transit, maintaining detailed audit logs, applying data masking where appropriate, and separating development and production environments.
Future of Analytics Pipeline Automation
Looking ahead, analytics automation is evolving rapidly with emerging trends like AI-assisted pipeline development, intelligent anomaly detection, automated root-cause analysis, advanced data observability, self-healing pipelines, and automated governance.
Future platforms will increasingly combine robust automation with intelligent decision support, helping data teams operate with greater agility and confidence.
Frequently Asked Questions
What is analytics pipeline automation?
Analytics pipeline automation involves using software tools and orchestration engines to execute, monitor, and manage data movement, transformation, and validation without manual intervention.
How does DataOps automate analytics pipelines?
DataOps applies software engineering practices—such as CI/CD, automated testing, version control, and orchestration—to streamline and secure data workflows from source to dashboard.
Why is automation important in analytics?
Automation eliminates repetitive manual tasks, reduces human error, speeds up data delivery, and ensures stakeholders receive fresh, reliable insights.
What tasks can be automated in a data pipeline?
Commonly automated tasks include data ingestion, scheduling, transformations, quality testing, code deployment, monitoring, alerting, and dashboard refreshes.
How does automated testing improve analytics quality?
Automated testing catches data defects, missing values, and schema changes before faulty information reaches executive dashboards and business reports.
What is data pipeline orchestration?
Orchestration is the coordination layer that manages task dependencies, execution order, scheduling, and error retries across a multi-step data workflow.
Which tools are used for analytics pipeline automation?
Popular tools include orchestrators like Apache Airflow, transformation frameworks like dbt, ingestion tools like Fivetran or Airbyte, and data quality tools like Great Expectations.
How does CI/CD work in DataOps?
CI/CD automates testing and deployment, ensuring that code changes to pipelines are automatically tested in staging before being safely released to production.
Can analytics pipelines be fully automated?
While most operational tasks can be automated, human oversight remains necessary for defining business rules, governance policies, and major architectural decisions.
How does TheDataOps.org explain analytics automation?
TheDataOps.org treats automation as part of a collaborative, end-to-end DataOps lifecycle focused on continuous improvement, quality, and pipeline reliability.
Conclusion
Mastering analytics pipeline automation transforms data delivery from a fragile, manual chore into a dependable engine of business value, making workflows more repeatable, testable, observable, and scalable. By automating repetitive tasks, embedding continuous data testing, utilizing orchestration and CI/CD, and monitoring pipeline health, organizations can build resilient data systems while keeping human oversight central to governance and strategy. Design $\rightarrow$ Automate $\rightarrow$ Test $\rightarrow$ Deploy $\rightarrow$ Monitor $\rightarrow$ Improve. For professionals seeking to deepen their expertise, exploring educational resources like TheDataOps.org provides valuable guidance on building reliable analytics engineering practices.
