Imagine discovering a broken data pipeline before business reports fail. For many data teams, the reality is much more painful. You log in on a Monday morning only to find that an undetected schema change over the weekend corrupted your primary analytics dashboard.
Executives have already made strategic decisions based on broken, incomplete information. This hidden operational breakdown happens every single day in organizations relying on outdated tracking methods.
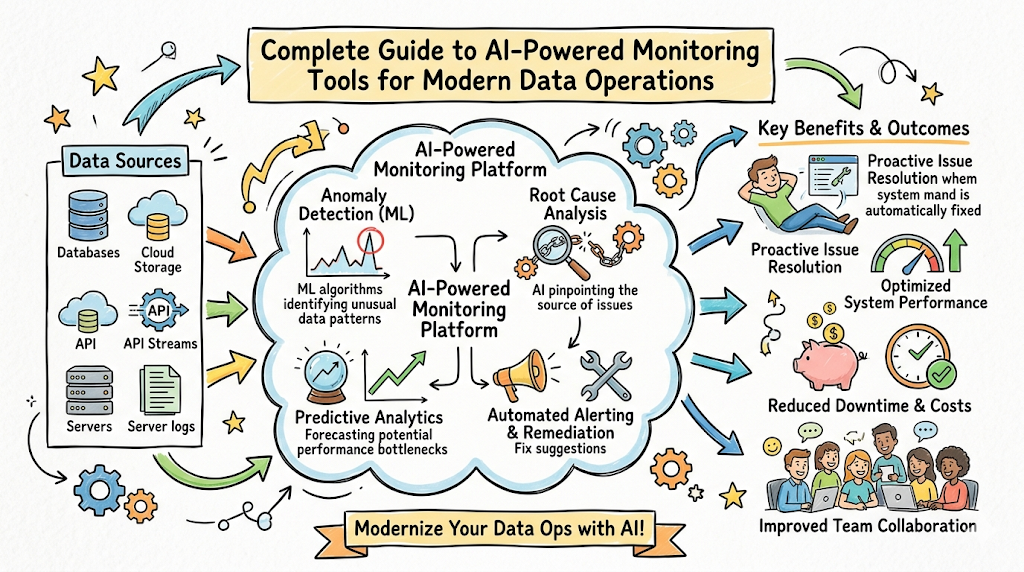
In simple terms, AI-powered monitoring tools for DataOps are software platforms that use machine learning to watch your data ecosystem. They automatically track the health of your pipelines, data quality, and storage systems without requiring humans to write thousands of manual validation rules.
Instead of waiting for a business user to complain about a broken chart, these intelligent systems analyze historical patterns to catch anomalies as they happen.
As companies scale their data footprints, tracking these movements manually becomes physically impossible. Modern data ecosystems are too complex, fast-moving, and unpredictable for traditional check-the-box alerting systems.
This comprehensive guide will teach you how intelligent monitoring functions, how it differs from traditional infrastructure alerts, and how to evaluate the top tools in the market to build a resilient data infrastructure.
To stay ahead of these architectural challenges, data teams must build foundational skills in automation and observability. Exploring structured educational resources through TheDataOps provides the practical training necessary to implement these advanced monitoring frameworks and design resilient data pipelines for your organization.
The Evolution of Monitoring in DataOps
Traditional Data Monitoring Challenges
Years ago, data monitoring was a straightforward but tedious task. Engineers wrote custom SQL scripts to check if a table updated on time or if a specific column contained empty values. This approach creates a reactive environment where you only find bugs after they cause damage.
As data ingestion volumes grew, this manual strategy collapsed. Teams found themselves writing more testing code than actual production data pipelines. When a pipeline broke for a reason nobody anticipated, the manual checks remained silent, allowing corrupted information to flow into production environments.
The Rise of Automated Data Observability
To solve the limitations of manual checks, the industry shifted toward automated data observability. This transition moved teams away from simply asking “Is the pipeline running?” to asking “Is the data inside the pipeline accurate and trustworthy?”
Automated observability platforms connect directly to your data warehouses, lakes, and orchestration tools. They automatically read metadata to learn how your data looks when it is healthy. This automated tracking removes the burden of writing manual test assertions for every new table your company creates.
AI Adoption in Modern Data Operations
Organizations are rapidly adopting AI-powered monitoring solutions because data volumes have outgrown human management capacity. Modern enterprise ecosystems handle thousands of daily data jobs across multi-cloud environments, making manual oversight impossible.
Machine learning models excel at recognizing subtle variations in data volume, processing times, and schema structures that a human engineer would never notice. By applying AI to operational metadata, companies turn their data teams from firefigters into proactive system architects.
Understanding AI-Powered Monitoring Tools for DataOps
The Core Architecture of Modern Monitoring Platforms
To understand how these platforms work, think of them as a multi-layered security system for your data. The base layer connects directly to your data sources, databases, and transformation tools to collect metadata without touching the underlying raw customer records.
+-----------------------------------------------------------------+
|                       Analytics & Alerting                      |
|            (Prioritized Alerts & Slack/PagerDuty)               |
+-----------------------------------------------------------------+
                                ^
                                |
+-----------------------------------------------------------------+
|                   Anomaly Detection Engine                      |
|            (Machine Learning Baseline Algorithms)               |
+-----------------------------------------------------------------+
                                ^
                                |
+-----------------------------------------------------------------+
|                    Metadata Ingestion Layer                     |
|           (Connectors to Warehouses, Lakes & Logs)              |
+-----------------------------------------------------------------+
Above the collection layer sits the machine learning engine, which creates statistical profiles of your data assets. It tracks how much data typically arrives, when it arrives, and what the structural shapes look like.
The top layer consists of the alerting and orchestration engine, which routes high-priority incidents to your engineering teams while automatically suppressing noisy, irrelevant warnings.
Daily Use Cases for Data Teams
This becomes critical when managing thousands of daily data jobs across a global business footprint. Consider an e-commerce data pipeline that processes millions of transactions every hour.
If a regional payment gateway alters its timestamp format slightly, an AI monitoring tool catches the structural drift immediately at the ingestion layer, alerting the team before the data reaches the central analytics warehouse.
Another daily scenario involves tracking volume drops. If an marketing API fails silently and sends zero records, the machine learning system recognizes that this specific hour typically receives fifty thousand records. It flags the sudden drop as an anomaly, allowing engineers to restart the API connection before marketing analysts run their daily performance reports.
Traditional Monitoring vs. AI-Powered Monitoring
Traditional monitoring relies on rigid, binary rules. For example, you might write a rule stating that a table must have more than one hundred rows after an update. If the table receives ninety-nine rows, an alert fires, even if that minor drop is perfectly normal for a holiday weekend.
AI-powered systems drop these static boundaries entirely. They evaluate data using context, time patterns, and historical trends. The intelligent system understands that data volume naturally thins out on holidays, meaning it will not wake up an on-call engineer for a non-critical, expected drop.
The Proactive Data Reliability Mindset
Adopting an intelligent monitoring tool requires a fundamental shift in how your operations team thinks. Success means moving away from a culture that constantly fixes broken reports to a culture focused on total data reliability.
When you trust your monitoring platform to catch anomalies automatically, engineers spend less time writing test cases and more time optimizing pipeline performance. This proactive posture builds deep trust across the entire business, ensuring analysts can rely on data without double-checking the source code.
The 7 Core Principles of AI-Powered Monitoring in DataOps
1. Continuous Data Pipeline Monitoring
Continuous tracking means maintaining absolute visibility across your entire data lifecycle, including ingestion, transformation, and final delivery. The monitoring tool watches your workflows end-to-end, rather than just inspecting the final data warehouse tables.
This end-to-end perspective helps you pinpoint exactly where a bottleneck or data corruption occurs. If an external extraction tool slows down, the monitor catches the delay before it ripples downstream to disrupt your core business transformation models.
2. Automated Anomaly Detection
Automated anomaly detection identifies unusual behavior in datasets and operational workflows without human intervention. The system builds an evolving baseline of your data patterns and flags data points that fall outside expected statistical ranges.
Data Volume
  ^
  |          *  *  *                      *  *
  |       *           *                *        *
  |     *               *            *            * <--- Expected Baseline
  |   *                   *        *
  | *                       *    *
  |---------------------------X-----------------------------> Time
                              ^
                       [ANOMALY DETECTED]
                   (Volume drops below threshold)
For instance, if a specific column suddenly contains 40% null values when its historical average is less than 1%, the engine flags the shift instantly. This automated discovery saves hours of manual inspection and prevents bad data from contaminating downstream dashboards.
3. Data Quality Intelligence
Data quality intelligence expands your visibility past simple operational uptime by constantly scoring the accuracy, completeness, consistency, and freshness of your information. It validates that the values inside your tables match real-world business realities.
In simple terms, a pipeline can run perfectly on time while still delivering completely corrupted information. Quality intelligence checks column distributions, value ranges, and relational integrity to ensure the data inside the pipeline is actually useful.
4. Root Cause Analysis Automation
Most data teams encounter this challenge: an executive notices an incorrect number on a dashboard, and five engineers spend the next two days digging through hundreds of upstream tables to find the root cause. AI tools completely eliminate this manual digging.
When an incident occurs, the platform automatically traces the data lineage backward to isolate the source of the error. It can show you instantly that a specific column modification in an upstream database three steps away caused the downstream dashboard failure.
5. Predictive Operational Insights
Intelligent monitoring tools do more than report what is broken right now; they forecast potential infrastructure and data issues before they impact your business operations. By analyzing performance trends, the system warns you if a storage system or pipeline is approaching a critical threshold.
Imagine discovering that a cloud data warehouse table is growing so fast that it will exceed its allocated query budget within two weeks. Predictive insights give your team enough lead time to optimize the underlying storage partition models before you receive an unexpected invoice.
6. Alert Prioritization and Noise Reduction
Alert fatigue is one of the biggest productivity killers in modern data engineering departments. When systems send hundreds of low-priority Slack alerts every day, engineers quickly learn to ignore them, causing them to eventually miss critical system failures.
AI platforms fix this by clustering related events into a single, cohesive operational incident. If an upstream database goes offline, the tool suppresses the hundreds of downstream dependency alerts, sending one high-priority alert that points directly to the core infrastructure failure.
7. Self-Healing and Automated Remediation
The ultimate goal of modern DataOps is building an autonomous, self-healing data ecosystem. When the monitoring platform detects a known, predictable pipeline failure, it can trigger automated corrective actions to restore the workflow without human intervention.
For example, if a data sync job fails due to a temporary cloud network timeout, the monitoring system can automatically trigger an intelligent retry script, clear the staging cache, and verify the data transfer completeness on the second attempt before notifying an engineer.
Key DataOps Monitoring Concepts Every Beginner Must Know
Data Monitoring vs. Data Observability — Explained Simply
Beginners frequently confuse monitoring with observability, but they represent different levels of operational visibility.
- Data Monitoring: Tracks known health metrics using explicit, predefined rules to tell you exactly when something goes wrong.
- Data Observability: Uses system outputs and metadata to help you understand why a complex, unpredictable problem occurred inside your pipeline.
- Data Monitoring Focus: Assesses operational state, system uptime, row counts, and binary pass-or-fail testing.
- Data Observability Focus: Analyzes system lineage, cross-system dependencies, structural drift, and deep root-cause discovery.
Data Quality Monitoring
Data quality monitoring measures the overall health of data values inside your storage infrastructure. It ensures your business decisions are grounded in accurate information by evaluating distinct quality characteristics.
Engineers look at completeness to verify no essential fields are missing, and correctness to confirm values fall within logical boundaries. They also check consistency across different systems to ensure an ID in your CRM matches the corresponding record in your billing platform.
Pipeline Reliability and Availability
Pipeline reliability evaluates the operational performance and execution consistency of your data integration workflows. It tracks whether your data processing jobs start on time, execute within reasonable windows, and finish successfully.
An available pipeline delivers data on an expected schedule. If your finance team expects fresh revenue numbers every morning at 6:00 AM, your monitoring system tracks the delivery cadence to ensure upstream infrastructure delays never break this business agreement.
AI and Machine Learning in Monitoring
Machine learning brings adaptive pattern recognition to your operational infrastructure. Instead of requiring an engineer to write static validation parameters, algorithms analyze historical log entries to build an understanding of normal operations.
These algorithms handle seasonal changes naturally. They recognize that data patterns change during end-of-quarter processing or holiday shopping surges, adjusting your system alerting thresholds dynamically to prevent false alarms during high-volume periods.
Incident Management in DataOps
Incident management is the structured workflow your operations team follows to identify, triage, investigate, and resolve an operational failure. It turns chaotic pipeline breakdowns into an organized, repeatable engineering response.
+-------------+      +-------------+      +-------------+      +-------------+
|  Detection  | ---> |   Triage    | ---> | Resolution  | ---> | Post-Mortem |
| (AI Tool    |      | (Automated  |      | (Engineers  |      | (Lineage    |
| Identifies) |      | Routing)    |      | Fix Issue)  |      | Analysis)   |
+-------------+      +-------------+      +-------------+      +-------------+
An efficient incident workflow relies on clear communication channels, automated ticket creation, and precise severity assignments. This organization guarantees that critical production bugs get immediate engineering eyes while minor, non-breaking schema updates go into the standard backlog.
The Four Pillars of Data Reliability
To build an enterprise-grade data infrastructure, your engineering team must focus on four foundational pillars:
- Observability: Maintaining deep visibility into the internal states, pipelines, and dependencies of your data systems.
- Quality: Ensuring structural validation, accurate data values, and compliance with business rules across all datasets.
- Automation: Removing manual work from pipeline deployment, anomaly validation, alert routing, and system recovery workflows.
- Governance: Controlling data access, tracking compliance standards, and managing clear documentation for metadata across the enterprise.
Traditional Monitoring vs. AI-Powered Monitoring — What’s the Real Difference?
The Philosophy Difference
The fundamental difference between these two approaches lies in how they handle unknown failures. Traditional monitoring operates on a defensive philosophy: you write rules for problems you have already experienced in the past. If a new type of failure occurs, the monitoring system misses it entirely.
AI-powered monitoring operates with an exploratory philosophy. It assumes that complex distributed data systems will fail in unexpected ways. By tracking anomalies across all layers simultaneously, it spots unusual behavior patterns even if your team has never encountered that specific issue before.
Roles & Responsibilities Compared
Shifting to an intelligent monitoring platform redefines how different members of your data team spend their working hours.
- Data Engineers: Stop writing thousands of lines of brittle testing code; instead, they focus on optimizing pipeline architecture and core infrastructure performance.
- Data Analysts: Spend less time verifying if numbers match upstream sources; they can build reports confidently knowing the platform validates data health automatically.
- Platform Engineers: Maintain underlying system integrations, optimize cluster allocations, and design the automated orchestration workflows that fix pipelines.
- DataOps Professionals: Oversee the entire data lifecycle, managing alerting priority rules, tracking platform SLAs, and improving incident response speeds.
Can Traditional and AI Monitoring Work Together?
Most enterprise organizations do not swap out their entire monitoring stack overnight. Instead, they implement a hybrid monitoring approach that blends traditional rule-based checks with advanced AI observability platforms.
You can use traditional monitoring for clear, binary business rules that must never change, such as ensuring a financial transaction field never contains a negative value. Meanwhile, you deploy your AI monitoring platform to watch for system anomalies, schema drift, and unexpected volume variations across thousands of tables.
Which Monitoring Strategy Should Organizations Choose?
The right strategy depends heavily on the size and complexity of your data footprint. If your team manages just a few data pipelines connecting to a single database, simple open-source validation scripts and basic infrastructure alerts are often enough.
However, if you manage multi-cloud environments, real-time data streams, and hundreds of downstream dashboards, manual tracking breaks down. At this enterprise scale, investing in an AI-powered monitoring platform becomes essential to protect your data reliability and stop operational overhead from consuming your engineering budget.
Real-World Use Cases of AI-Powered Monitoring Tools
Monitoring Enterprise Data Warehouses
Modern data warehouses contain petabytes of corporate information used by thousands of employees. AI monitoring tools sit on top of platforms like Snowflake, BigQuery, or Databricks, analyzing query logs to find performance bottlenecks and storage inefficiencies.
If a data analyst accidentally executes an unoptimized cross-join query that spikes cloud processing costs, the system catches the resource anomaly in real time. This rapid detection allows administrators to kill the query before it wastes thousands of dollars in compute budget.
Monitoring ETL and ELT Pipelines
Data movement processes are highly vulnerable to unexpected failures during extraction and transformation phases. Intelligent monitoring tools track data payloads as they move through orchestration tools like Apache Airflow or Prefect.
+------------------+       +------------------+       +------------------+
|  Source Systems  | ----> |  Transformation  | ----> |  Data Warehouse  |
|  (API/Databases) |       | (Airflow/dbt)    |       | (Snowflake/BQ)   |
+------------------+       +------------------+       +------------------+
         |                          |                          |
         v                          v                          v
+------------------------------------------------------------------------+
|                      AI Monitoring Platform                            |
|             (Tracks Volume, Freshness, & Schema Drift)                 |
+------------------------------------------------------------------------+
If an upstream application developer modifies a database column from an integer to a string, your transformation pipeline would normally crash during execution. An AI monitor identifies this schema mutation immediately upon extraction, allowing engineers to pause downstream execution before corrupted text enters analytical tables.
Monitoring Business Intelligence Platforms
The ultimate goal of a data pipeline is delivering dependable information to decision-makers. Monitoring tools protect business intelligence suites like Tableau, PowerBI, and Looker by ensuring the underlying dashboard calculations stay accurate.
When an executive opens an enterprise sales report, they need to know the data is completely fresh. If an upstream data refresh job runs late, the monitoring system can automatically apply an alert badge directly to the dashboard, warning viewers that they are looking at older data while engineers resolve the delay.
Monitoring Cloud Data Platforms
Managing data health across modern cloud environments introduces significant tracking challenges. Organizations frequently run workloads across multiple public clouds, mixing structured transactional databases with massive unstructured object storage buckets.
AI-powered observability platforms normalize metadata across these diverse clouds. They give platform architects a single interface to monitor data lineage, track movement costs, and maintain compliance standards across Amazon Web Services, Microsoft Azure, and Google Cloud Platform simultaneously.
Monitoring Real-Time Data Streams
High-velocity event streams from IoT devices, mobile applications, or clickstream trackers require immediate anomaly identification. Traditional monitoring tools cannot keep up with this velocity because they rely on batch checks that run every few hours.
Intelligent streaming monitors process event metrics in real time as data flows through platforms like Apache Kafka or Amazon Kinesis. If the incoming event rate drops sharply due to a mobile app update bug, the platform detects the velocity shift within seconds, allowing developers to roll back the broken update immediately.
Common Mistakes Organizations Make with Data Monitoring
Mistake 1 — Monitoring Infrastructure but Ignoring Data Quality
Many engineering teams assume that because their servers are online and their databases have healthy CPU utilization, their data must be correct. This infrastructure-centric focus completely misses silent data corruption.
Your servers can run with perfect uptime while an upstream software bug writes empty fields into critical columns. To avoid this blind spot, you must deploy monitoring tools that inspect the data values inside your pipelines, not just the hardware hosting them.
Mistake 2 — Depending Only on Manual Checks
Believing your team can write manual test assertions for every data field is a recipe for operational failure. As your company adds new products, features, and marketing channels, your data catalog expands exponentially.
Traditional Testing:  [New Table] ---> [Manually Write 20 Assertions] = High Effort
AI Observability:     [New Table] ---> [AI Automatically Baselines]   = Zero Effort
Relying completely on manual validation guarantees that engineers will skip creating tests for minor tables to save time. These untracked tables quickly become a prime source of hidden data errors that eventually impact your downstream business reports.
Mistake 3 — Creating Too Many Alerts
When setting up a new monitoring system, teams often turn on every alert possible because they fear missing an incident. This approach backfires quickly, flooding Slack or PagerDuty with non-critical notices.
When engineers receive alerts for minor data variations that have zero actual business impact, they stop paying attention to the monitoring system entirely. You must configure your alerts selectively, reserving high-severity notifications for issues that break production pipelines or degrade core data products.
Mistake 4 — Ignoring Historical Monitoring Trends
Many operations teams treat alerts as isolated, one-off events to fix and forget. By ignoring historical incident trends, you miss deep structural issues within your data infrastructure.
If a specific transformation pipeline breaks every single Friday afternoon, fixing it manually each week solves the symptom but ignores the disease. Analyzing long-term monitoring trends helps teams identify systemic bugs, like recurring network constraints or poorly provisioned database clusters.
Mistake 5 — Delaying Incident Response
Catching a data error early does little good if your engineering team takes days to review the alert and apply a fix. Delayed incident response allows corrupted information to spread through downstream systems, compounding the cleanup effort.
When bad data sits in a data warehouse for days, it contaminates downstream aggregate tables, historical models, and caches. Organizations must establish clear operational playbooks and on-call rotations to ensure teams triage and resolve critical alerts quickly.
Mistake 6 — Treating Monitoring as a One-Time Project
Data ecosystems are dynamic environments that evolve constantly as teams ship new code, adjust business logic, and integrate new software tools. Treating monitoring setup as a finite project with an end date ensures your tooling will quickly become obsolete.
Continuous tracking requires continuous improvement. Your engineering team must routinely audit your observability platform, refine anomaly thresholds, update data lineage maps, and adjust alerting pathways to match the changing shape of your enterprise data architecture.
Essential AI-Powered Monitoring Tools & Technologies
Data Observability Platforms
The enterprise data observability space features specialized tools built to provide end-to-end operational visibility.
- Monte Carlo: Known for pioneer work in data observability, this platform connects across your data stack to track freshness, volume, schema, and lineage out of the box without manual configuration.
- Bigeye: Focuses heavily on automated data quality metrics and deep granular anomaly detection, helping teams identify subtle data drift across complex tables.
- Acceldata: Provides comprehensive data observability by blending pipeline data tracking, quality validation, and cloud compute cost optimization into a single platform.
Data Pipeline Monitoring Solutions
Some platforms focus specifically on tracking the execution health and internal operational metrics of your data processing jobs.
- Databand: Owned by IBM, this solution specializes in data pipeline execution observability. It integrates directly with orchestrators like Airflow and dbt to help engineers track job run durations, catch process execution failures, and diagnose pipeline bugs before data lands in your warehouse.
Data Quality Validation Platforms
If your primary goal is validating the internal values and business logic across your datasets, specialized quality platforms are highly effective.
- Soda: An open-source and enterprise platform that allows data teams to write human-readable quality checks while using machine learning to detect unexpected data anomalies automatically.
- Great Expectations: A widely adopted open-source framework that helps teams define, maintain, and check data quality expectations throughout their ingestion and transformation workflows.
Infrastructure Monitoring Technologies
For teams looking to connect data application health with underlying server performance, enterprise infrastructure monitoring tools are invaluable.
- Splunk: A powerful platform for collecting, analyzing, and indexing massive volumes of machine-generated log data to troubleshoot enterprise infrastructure problems.
- Datadog: A unified cloud monitoring solution that aggregates metrics, traces, and logs across servers, databases, and data applications to provide complete stack visibility.
- New Relic: An all-in-one observability platform that helps engineers track application performance, monitor database queries, and isolate infrastructure bottlenecks.
- Dynatrace: Uses a powerful core AI engine to automate cloud infrastructure tracking, discover microservice topologies, and diagnose application performance degradations.
AI and Analytics Technologies
The underlying power of modern monitoring platforms comes from machine learning algorithms designed for time-series analysis and log evaluation. These technologies parse unstructured operational text, recognize repeating patterns over time, and calculate dynamic confidence intervals.
By running these analytics models against system metadata, monitoring tools remove the need for human engineering teams to manually manage thousands of static, brittle tracking rules.
Becoming a DataOps Monitoring Expert
Essential Skills Every DataOps Professional Needs
Building a career in modern data operations requires a mix of data engineering skills, systems thinking, and analytical capabilities.
- Advanced SQL: You must understand how to query metadata tables, analyze information schemas, and isolate data anomalies across complex relational databases.
- Python Programming: Useful for building automation scripts, interacting with monitoring platform APIs, and configuring custom data validation checks.
- Data Pipeline Architecture: Deep knowledge of ETL/ELT patterns, orchestration engines, data warehousing, and modern cloud architecture design.
- Observability Practices: Understanding how to interpret lineage diagrams, configure effective alerting pathways, and run thorough incident post-mortems.
- System Automation: The ability to design self-healing workflows, program automated retries, and manage infrastructure as code configurations.
Step-by-Step Learning Path
Start your journey by mastering core data engineering fundamentals. Learn how data moves from transactional databases into central data warehouses, and gain practical experience writing clear transformation code using tools like SQL and dbt.
Once you understand basic data movement, study traditional data quality frameworks. Practice writing static validation rules to learn their limits, then transition into modern observability strategies by deploying open-source monitoring platforms within your test projects to understand how automated baseline tracking works.
Certifications and Learning Programs Worth Exploring
To validate your skills and stand out to enterprise employers, look into professional certifications across the cloud and data ecosystems. Consider pursuing data engineering credentials from major cloud providers like Snowflake, AWS, Azure, or Google Cloud.
Additionally, focus on specialized curriculum paths covering DevOps methodologies, site reliability engineering principles, and automated data pipeline orchestration frameworks.
Educational Resources with TheDataOps
As you scale your professional capabilities, accessing high-quality, practical training materials is essential. Seeking out expert mentorship and structured curriculum plans helps you cut through the noise of complex technical tooling.
By exploring the technical guides and educational resources available through TheDataOps, you can systematically build the deep technical expertise required to architect, scale, and monitor modern data operating frameworks.
The Future of AI-Powered Monitoring in DataOps
Autonomous Data Operations
The next major evolution in DataOps is the transition from simple anomaly alerting to completely autonomous data environments. Future data systems will not just tell you that a pipeline failed or suggest a fix; they will rewrite transformation models and deploy patches automatically.
When a schema mutation occurs upstream, an autonomous system will evaluate the change, update downstream column mappings dynamically, test the modified pipeline in an isolated staging environment, and deploy the fix to production without requiring human approval.
AI-Driven Data Quality Management
Data quality management will shift from reactive validation to predictive prevention. Advanced machine learning models will evaluate data values at the exact moment of creation inside edge devices and application interfaces, blocking anomalies before they ever enter an ingestion pipeline.
These systems will also understand business context deeply. The monitoring tool will recognize subtle shifts in global market conditions, automatically adjusting corporate data quality definitions to match changing real-world business environments without manual recalibration.
Monitoring in Cloud-Native Data Ecosystems
As organizations adopt decentralized data mesh architectures, data monitoring must adapt to track information across distributed, independent business domains. Traditional centralized monitoring units are ill-suited for these complex setups.
Future observability platforms will function as federated, lightweight layers that deploy automatically alongside any new data product. These cloud-native monitors will communicate with one another to trace cross-organizational data lineage, maintain data contracts, and optimize compute costs across diverse cloud providers.
Skills That Will Matter Most in Future DataOps Careers
As artificial intelligence automates basic scripting, data validation tasks, and low-level system troubleshooting, human engineering roles will evolve significantly. The most successful professionals will focus on high-level architecture design and system optimization.
Expertise in managing complex data contracts, designing end-to-end observability strategies, and enforcing corporate data governance frameworks will become highly valuable. Professionals who couple deep data engineering skills with a systematic understanding of business reliability will lead the next generation of data operations teams.
FAQ Section
- What is the difference between data monitoring and data observability?
Data monitoring is a reactive practice that uses explicit, predefined rules to track specific metrics and alert you when system performance crosses those thresholds. Data observability is a broader, proactive approach that uses system metadata and outputs to help you understand the internal health of complex pipelines, allowing you to diagnose the root causes of completely unexpected failures.
- How do AI-powered monitoring tools reduce alert fatigue for data engineers?
AI-powered tools reduce alert fatigue by using machine learning algorithms to cluster related error events into a single, comprehensive incident report. They analyze historical patterns to adjust alerting thresholds dynamically based on seasonality, while automatically suppressing minor, non-critical alerts that do not impact downstream business systems.
- Can open-source tools handle enterprise-grade data quality monitoring?
Yes, open-source tools like Great Expectations and Soda can handle enterprise data quality validation when integrated correctly into automated data pipelines. However, as data infrastructure scales across multi-cloud environments, organizations often pair these open-source frameworks with commercial observability platforms to get end-to-end lineage tracking and automated anomaly detection out of the box.
- What are the most important metrics to track when monitoring data pipelines?
The most critical metrics to track are data freshness (when the data was last updated), data volume (the total number of expected records delivered), schema stability (changes to table structures or column data types), and data quality scores (the distribution, correctness, and completeness of the values inside your columns).
- Why should a company invest in AI monitoring tools if their traditional pipelines run fine?
Even if traditional pipelines run without errors, silent data corruption can still occur when upstream software updates modify data formats or introduce empty values. AI monitoring tools protect organizations from making critical strategic decisions based on corrupted information by validating the actual data values inside pipelines, rather than just checking if the servers are online.
- What career opportunities exist for professionals specializing in DataOps monitoring?
Professionals specializing in DataOps monitoring can pursue high-demand roles such as DataOps Engineer, Data Reliability Engineer, Platform Architect, and Data Operations Manager. As enterprises continue to scale their cloud data infrastructure, the ability to build and manage resilient, observable data systems has become one of the most sought-after skill sets in the technology sector.
- What is structural drift and how does an intelligent monitoring tool identify it?
Structural drift occurs when the schema, data types, or organization of an upstream data source changes without coordination, such as a database column shifting from an integer to a text string. Intelligent monitoring platforms identify this drift by parsing metadata automatically at the point of ingestion, flagging structural mutations before the data reaches your analytics tables.
- How does automated root cause analysis accelerate incident resolution?
When a dashboard metric breaks, automated root cause analysis saves hours of engineering time by tracing data lineage backward across your entire infrastructure. Instead of engineers manually reviewing hundreds of transformation scripts, the platform isolates the exact upstream table, API failure, or bad column modification that caused the downstream issue.
- What is a hybrid monitoring approach and when should an enterprise use it?
A hybrid monitoring approach combines traditional, rule-based checks with advanced AI-driven observability. Enterprises use this strategy to handle complex data environments: traditional monitoring handles strict, unchanging business logic (e.g., verifying a price field is never negative), while the AI engine adapts to unpredictable pattern changes, volume shifts, and anomalies across thousands of tables.
- How do cloud-native architectures change data monitoring requirements?
Cloud-native architectures shift data infrastructure away from centralized, single-cloud setups toward distributed data mesh environments and multi-cloud systems. This change requires lightweight, federated monitoring layers that can deploy automatically alongside new data products to track lineage, monitor cross-system dependencies, and control compute costs simultaneously across diverse cloud networks.
Final Summary
Building a reliable data infrastructure requires moving past outdated, reactive tracking methods. Relying entirely on manual code checks and basic infrastructure alerts leaves your business vulnerable to silent data corruption, costly pipeline failures, and broken analytics dashboards. Embracing modern AI-powered monitoring tools allows your engineering team to automate anomaly detection, isolate root causes instantly, and ensure consistent data quality across your entire enterprise footprint.