Introduction
Every data engineer knows the frustration of waking up to broken data pipelines, corrupted tables, or an executive dashboard showing blank tiles. Traditionally, data teams discover these problems only after downstream reports break or business users file urgent tickets. This reactive approach creates operational drag, erodes stakeholder trust, and turns daily data engineering into firefighting. Predictive maintenance offers a better path forward. In physical engineering, predictive maintenance uses telemetry and sensor patterns to service machinery before a breakdown occurs. In software and data operations, predictive maintenance tools for DataOps analyze pipeline telemetry, infrastructure metrics, execution logs, and data distribution patterns to identify degradation before outages happen. Proactive detection allows teams to intervene early, optimize platform resources, and ensure uninterrupted data delivery. You can explore foundational DataOps frameworks and best practices directly on TheDataOps.org.
Understanding Predictive Maintenance in DataOps
To understand predictive maintenance in DataOps, consider how it differs from traditional reactive monitoring.
Reactive monitoring alerts your team after an event reaches a failure state. A job crashes because it runs out of memory, a task fails due to a network timeout, or an unannounced upstream schema change breaks a transformation script. In all of these cases, the failure has already occurred, downstream dependencies are delayed, and data consumers are impacted.
Predictive maintenance operates on early signals. Instead of waiting for a threshold breach, predictive systems continuously analyze continuous telemetry—such as historical run durations, node memory trends, queuing times, and record arrival rates.
By modeling these historical and real-time data points, predictive algorithms identify subtle drift:
- Memory utilization that creeps 5% higher with each daily run, indicating an upcoming out-of-memory error next week.
- Record arrival rates steadily declining from an API endpoint, signaling potential source connection degradation before the ingestion pipeline stalls completely.
- Storage partition growth rates pointing toward disk exhaustion days before a warehouse table locks.
Predictive maintenance shifts the team focus from disaster recovery to preventative maintenance, giving engineers time to address structural issues during normal working hours.
Why DataOps Teams Need Predictive Maintenance
Modern data platforms are distributed, multi-layered systems. Data moves through third-party APIs, message brokers, streaming clusters, batch orchestration engines, transformation layers, and analytical warehouses. A minor issue in one stage can cascade into massive downstream failures.
Here are the primary operational challenges that predictive maintenance helps solve:
- Preventing Data Pipeline Failures: Batch jobs often fail due to subtle resource constraints, transient cluster timeouts, or unmanaged volume spikes. Predictive monitoring detects when memory buffers or worker queues approach safety thresholds.
- Catching Silent Data Delays: When upstream pipelines take longer to process incremental data batches, downstream transformations fall behind schedule. Predictive tools calculate whether current processing velocity will cause an SLA breach hours before the SLA deadline expires.
- Managing Unannounced Schema Changes: Upstream application developers frequently add, drop, or rename columns without notifying data teams. Anomaly detection flags unexpected column type mismatches and altered payloads before they propagate corrupt tables into analytics tiers.
- Halting Data Quality Degradation: Rather than a pipeline failing completely, the data itself may become inaccurate—such as an unusual surge in null values, impossible negative values in revenue columns, or truncated strings. Observability tools flag distribution drift early.
- Avoiding Resource Exhaustion: Cloud warehouses and distributed computing clusters face storage limits, query concurrency limits, and memory saturation. Predictive analytics forecasts capacity bottlenecks based on consumption trends, helping teams optimize infrastructure costs.
Types of Predictive Maintenance Tools
Implementing predictive maintenance across a data platform requires distinct tool categories working together. Below are the primary classes of tools used by modern DataOps teams:
1. Data Observability Platforms
Data observability platforms monitor the end-to-end health of your data assets. They focus on the core pillars of data health: freshness, volume, schema, distribution, and lineage.
- What they do: Connect directly to data warehouses, lakes, and transformation tools to extract metadata, run automated distribution tests, and build lineage graphs.
- Support for predictive maintenance: They establish baseline statistical profiles for tables and columns. When record counts fluctuate abnormally or values drift beyond historical confidence intervals, these platforms trigger early warnings.
- When to use: When you need deep visibility into data quality and want to catch bad data before business stakeholders discover it on executive dashboards.
2. Pipeline and Workflow Orchestrators
Modern orchestrators coordinate task dependencies, manage run schedules, and collect fine-grained execution metadata for every job run.
- What they do: Schedule DAGs (Directed Acyclic Graphs), manage execution environments, manage retry logic, and log task runtimes.
- Support for predictive maintenance: Orchestrator metadata engines expose task-level run histories. Machine learning models analyze this metadata to predict job runtimes, detect task queue congestion, and identify slow tasks.
- When to use: Essential for all centralized batch and real-time pipeline management.
3. Infrastructure and System Monitoring Tools
Infrastructure monitoring platforms monitor underlying compute instances, container environments (such as Kubernetes), virtual machines, and network bandwidth.
- What they do: Collect CPU utilization, memory pressure, disk I/O, network latency, and container restart counts across compute clusters.
- Support for predictive maintenance: Metric analytics forecast compute and disk exhaustion. For example, if a transformation cluster consistently consumes 90% of allocated memory during peak loads, these tools alert engineers before the next surge triggers an out-of-memory crash.
- When to use: Critical for self-managed Spark clusters, Kubernetes deployments, and hybrid cloud infrastructures.
4. Machine Learning-Powered Anomaly Detection Platforms
These specialized platforms focus specifically on applying time-series forecasting, clustering, and outlier detection models to operational metrics.
- What they do: Ingest continuous log streams, execution traces, and metric streams, processing them through statistical algorithms to detect subtle anomalies that static threshold alerts miss.
- Support for predictive maintenance: They differentiate normal periodic fluctuations (such as lower traffic on weekends) from genuine operational degradation, significantly reducing false positives.
- When to use: When static rule-based alerts generate excessive noise or fail to catch complex, multi-variable pipeline issues.
5. Log Analytics and Tracing Solutions
Log aggregation platforms ingest unstructured and semi-structured operational logs generated by pipeline workers, database engines, and ingestion connectors.
- What they do: Index massive volumes of log data, making them searchable and visualizable in real time.
- Support for predictive maintenance: Natural language processing and pattern recognition group recurring warning messages, highlighting emerging connector timeouts or database lock contentions before they cause system-wide halts.
- When to use: Essential for distributed debugging, root cause analysis, and multi-service log correlation.
6. Alerting and Incident Management Platforms
Alerting systems aggregate signals from observability, infrastructure, and log tools to route notifications to the right engineers.
- What they do: Manage on-call rotations, aggregate duplicate alerts, and automate incident response runbooks.
- Support for predictive maintenance: They prioritize predictive warning signals, allowing engineers to address non-critical drift during office hours rather than receiving high-severity emergency pages at midnight.
- When to use: When multiple tools generate alerts and teams require centralized routing, escalation, and incident tracking.
How Predictive Maintenance Works in a DataOps Workflow
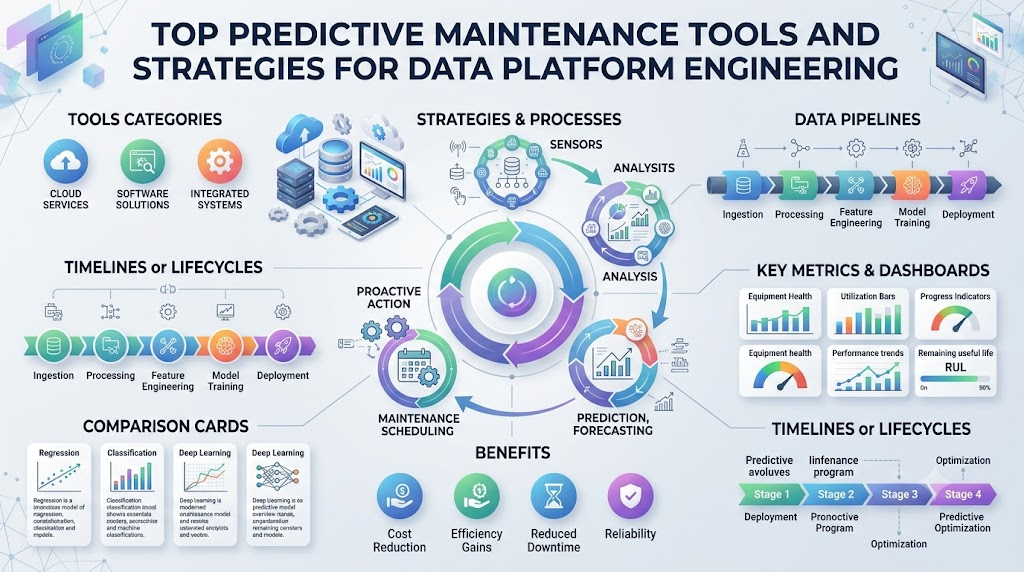
Predictive maintenance is a structured, cyclical process rather than a standalone tool. A robust workflow moves through seven distinct stages:
Data Collection → Monitoring → Anomaly Detection → Prediction → Alert → Automated/Manual Response → Continuous Learning
Stage 1: Data Collection
The system gathers operational telemetry from every layer of the data stack. This includes pipeline execution times, task status, query performance logs, CPU/memory usage metrics, table row counts, schema definitions, and column statistics.
Stage 2: Monitoring
The platform aggregates telemetry to establish historical baselines. The system learns standard behavior patterns, accounting for daily schedules, weekly batch variations, and month-end processing spikes.
Stage 3: Anomaly Detection
Telemetry streams pass through statistical models (such as moving averages, Holt-Winters forecasting, or isolation forests). The system checks for deviations in execution duration, data arrival rate, null-percentage spikes, or unexpected schema alterations.
Stage 4: Prediction
Rather than just identifying that an anomaly occurred, predictive algorithms evaluate the trajectory. The platform calculates whether the detected trend will cause an SLA violation, out-of-memory failure, or storage limit breach over upcoming cycles.
Stage 5: Alert
When a high-confidence failure prediction occurs, the platform issues an alert enriched with contextual metadata: the affected pipeline, historical runtime comparisons, downstream table dependencies, and likely root causes.
Stage 6: Automated or Manual Response
Depending on the severity and confidence score:
- Automated Action: The system can dynamically scale cluster resources, restart hung worker nodes, adjust query concurrency limits, or quarantine anomalous source partitions.
- Manual Action: An analytics engineer reviews the alert, inspects upstream changes, optimizes a slow query, or coordinates with source application teams.
Stage 7: Continuous Learning
The outcome of the intervention feeds back into the predictive model. The system records whether the failure prediction was accurate, adjusting sensitivity thresholds and refining anomaly detection models to prevent future false alarms.
Practical Example: Catching a Silent Execution Bottleneck
Consider an e-commerce platform where a daily ETL pipeline aggregates customer transactions, updates inventory levels, and populates financial reporting tables. The pipeline has a strict business SLA: all tables must be updated by 06:00 UTC for morning executive reviews.
Expected Execution: 45 minutes (Completes by 03:45 UTC)
SLA Deadline:       06:00 UTC
Safety Buffer:      2 hours, 15 minutes
The Emerging Problem
Over three weeks, upstream transaction volumes grow steadily by 2% per week. However, an unindexed table join in the transformation query causes processing time to increase non-linearly:
- Week 1: Runtime increases from 45 minutes to 58 minutes.
- Week 2: Runtime increases to 1 hour, 22 minutes.
- Week 3: Runtime increases to 1 hour, 55 minutes.
The Reactive Approach
Under traditional monitoring, no alert triggers because the job still passes every morning, and the tables are refreshed before 06:00 UTC.
On Monday of Week 4, a minor marketing campaign increases transaction volume by another 10%. The pipeline runs for 3 hours and 15 minutes, failing the 06:00 UTC SLA. Executives open dashboards with missing data, and the data team spends the entire morning under pressure troubleshooting the pipeline.
The Predictive Maintenance Approach
With predictive maintenance tools enabled:
- Telemetry Tracking: The orchestration engine logs execution times for every transformation task.
- Trend Modeling: The predictive engine recognizes that while individual runs succeed, the rate of execution time growth is statistically abnormal relative to linear data volume growth.
- SLA Projection: By mid-Week 2, the prediction algorithm forecasts that at the current rate of degradation, the pipeline will breach its 06:00 UTC SLA within 10 to 14 days.
- Early Alert: An engineering ticket is automatically generated: “Warning: Pipeline [Daily_Finance_Transform] runtime growing at 18% weekly. SLA breach predicted within 12 days.”
- Proactive Fix: During normal sprint hours, a data engineer reviews the query plan, notices the missing index on the customer join key, and applies the optimization.
- Result: Runtime returns to 42 minutes. Zero downtime occurs, no SLAs are breached, and business operations continue without interruption.
Benefits of Predictive Maintenance in DataOps
Adopting predictive maintenance provides measurable operational advantages for data engineering and business teams:
- Reduced Unplanned Downtime: Early warnings allow engineers to fix failing tasks, memory leaks, and broken connectors before they interrupt production operations.
- Reliable Data Delivery: Consistent pipeline execution ensures business users, reporting dashboards, and machine learning models receive clean, fresh data on schedule.
- Lower Operational Stress: Teams shift away from high-pressure, late-night firefighting toward scheduled, orderly maintenance tasks during regular working hours.
- Optimized Infrastructure Spending: Predictive capacity forecasting prevents over-provisioning compute resources while avoiding costly emergency scaling when unmanaged workloads spike.
- Increased Stakeholder Trust: When data issues are detected and resolved internally before downstream consumers notice missing or corrupted figures, organizational confidence in data assets improves.
Challenges and Limitations
While valuable, predictive maintenance requires thoughtful planning and realistic expectations. Teams must navigate several operational trade-offs:
- Managing Alert Fatigue: Poorly calibrated anomaly detection models can flag normal variations as critical risks. High rates of false alarms lead engineers to ignore alerts, defeating the purpose of the system.
- Data Quality of Telemetry: Predictive models rely on historical operational logs and metrics. Incomplete logging, missing run histories, or erratic cluster metrics degrade the accuracy of failure predictions.
- Integration Complexity: Connecting observability, logging, orchestration, and incident platforms across diverse hybrid cloud architectures requires intentional engineering time and ongoing maintenance.
- Risks of Unvalidated Automation: Triggering automated remediation (such as auto-restarting clusters or modifying query plans) based on inaccurate predictions can destabilize active production pipelines.
- Model Maintenance Overhead: Anomaly baselines change as business operations evolve. Models must be continuously tuned to account for seasonal trends, holiday business spikes, and structural platform migrations.
Best Practices for Implementing Predictive Maintenance
To implement predictive maintenance effectively without overwhelming your team, follow these practical guidelines:
- Start with Business-Critical Pipelines: Do not attempt to instrument every pipeline at once. Identify the top 10% to 20% of data assets that drive core business decisions or customer-facing applications and deploy predictive monitoring there first.
- Track Both Data and Infrastructure Metrics: A job failure can stem from a bad upstream string format or an exhausted compute node. Monitor data metrics (freshness, schema, row counts) alongside infrastructure telemetry (CPU, memory, disk I/O).
- Establish Realistic Baselines: Ensure your anomaly detection models analyze sufficient historical data (at least 30 to 60 days) to account for regular weekly cycles and month-end spikes before enabling automated alerting.
- Tune Alert Sensitivity: Group low-urgency drift warnings into weekly maintenance digests while reserving direct on-call pages for high-probability, high-impact impending failures.
- Verify Before Automating: When introducing automated healing actions, run the system in “advisory mode” first. Let the tool recommend actions for human validation before granting it permission to execute automated restarts or resource changes.
- Regularly Audit False Positives: Schedule regular reviews of trigger logs. If a specific metric generates frequent false alarms, adjust its statistical thresholds or retrain the underlying model.
- Embed Telemetry in Incident Reviews: When a pipeline outage occurs, analyze why existing predictive signals missed the event. Update monitoring rules to capture those preliminary indicators in the future.
Future Trends in DataOps Predictive Maintenance
As data architectures expand, predictive maintenance tools continue to mature alongside developments in machine learning and automated platform engineering:
- Autonomous Self-Healing Pipelines: Future platforms will increasingly move beyond simple alerts to execute safe, automated remediation—such as rerouting queries around failing nodes, reallocating memory pools, and applying schema transformations dynamically.
- AI-Assisted Root Cause Diagnosis: Advanced language models and diagnostic agents will analyze execution logs, code commits, and lineage graphs simultaneously, providing engineers with plain-language explanations of why a failure is developing and suggesting precise code fixes.
- Unified Data & Platform Observability: The boundaries between infrastructure monitoring, pipeline orchestration, and data quality testing will continue to blur, creating consolidated control planes for all data operations.
- Proactive Data Quality Contracts: Emerging frameworks will validate data quality constraints at the point of ingestion, predicting downstream compatibility issues before records are written to storage layers.
FAQs
- What is the core difference between predictive maintenance and standard pipeline monitoring?
Standard monitoring is reactive—it triggers an alert only after a task fails, a metric crosses a static threshold, or a job crashes. Predictive maintenance is proactive—it evaluates historical trends and real-time telemetry to forecast degradation, alerting engineers before an actual outage occurs.
- Which types of tools are essential for building a predictive DataOps stack?
A comprehensive stack typically includes pipeline orchestrators for task metadata, infrastructure monitoring tools for system resource health, data observability platforms for data quality and schema tracking, log aggregators for error parsing, and automated anomaly detection engines.
- How does machine learning support predictive maintenance in DataOps?
Machine learning models analyze time-series telemetry (such as execution durations, record arrival volumes, and memory usage) to learn baseline behaviors, filter out seasonal noise, and detect subtle patterns that indicate impending failures.
- Can predictive maintenance eliminate all data pipeline failures?
No. While predictive maintenance prevents issues caused by gradual resource exhaustion, slow memory leaks, query degradation, and volume drift, it cannot anticipate random external events like sudden cloud provider outages, unannounced third-party API deprecations, or sudden physical hardware faults.
- How can a small data team start with predictive maintenance without large budgets?
Small teams can start by leveraging the built-in metadata and logging capabilities of their existing orchestrators and databases. Tracking simple trends—such as daily job runtimes, table row count variations, and cluster memory utilization—provides immediate predictive value before investing in specialized commercial tools.
- What is the biggest risk when deploying predictive maintenance tools?
The primary risk is alert fatigue. If anomaly detection algorithms are poorly tuned or lack sufficient baseline history, they will generate excessive false warnings, leading data engineers to overlook genuine high-priority alerts.
- How does predictive maintenance help with cloud data warehouse cost management?
By analyzing query execution times, compute node saturation, and storage consumption trends, predictive tools help teams identify inefficient queries and runaway compute clusters early, preventing unexpected billing spikes at the end of the month.
- When should a team automate remediation versus relying on manual engineer intervention?
Automated remediation is best suited for well-understood, low-risk operational tasks—such as dynamically scaling memory pools or restarting a stalled worker node. Complex issues involving business logic, schema changes, or query optimizations should remain human-reviewed.
- How does data lineage contribute to predictive maintenance?
Data lineage maps dependencies across your entire data ecosystem. When an anomaly or potential delay is detected upstream, lineage graphs allow the predictive engine to calculate which downstream tables, dashboards, and business teams will be impacted.
- What metrics are most valuable for predicting data pipeline failures?
The most valuable predictive indicators include task execution duration trends, worker node memory and CPU utilization rates, record ingestion volume velocity, data arrival latency, and column-level null-value percentages.
Conclusion
As modern organizations rely on continuous data streams to guide operational decisions and power machine learning applications, data platform reliability has become mission-critical. Relying on reactive alerting leaves data engineering teams in a continuous cycle of emergency troubleshooting, missed SLAs, and declining stakeholder trust.
Predictive maintenance tools for DataOps provide a structured way to transform data platform operations. By collecting comprehensive system telemetry, establishing statistical baselines, and applying intelligent anomaly detection, teams can identify emerging performance bottlenecks, data quality drift, and infrastructure constraints well before they escalate into production outages. Combining proactive tooling with disciplined DataOps best practices allows data engineers to spend less time fixing broken pipelines and more time delivering reliable, high-value data products.
