Introduction
In the modern enterprise landscape, decisions are only as good as the data that drives them. Organizations increasingly depend on fast, reliable data to power real-time dashboards, train machine learning models, and execute strategic corporate maneuvers. However, the rise of complex, distributed architectures has introduced significant business risks. Poor-quality data costs organizations millions of dollars annually in operational inefficiencies, regulatory non-compliance, and flawed strategic decisions.
Consider a global e-commerce enterprise where a broken extraction script alters currency conversion rates in the central ingestion engine. Without automated checks, this corrupt data flows straight into the executive financial dashboard. By afternoon, executive leadership halts a major marketing campaign based on a false drop in daily revenue. This real-world example demonstrates that a single silent data issue can instantly paralyze business operations and destroy executive trust. For comprehensive educational resources, industry benchmarks, and community discussions on architectural paradigms, visit TheDataOps, the premier platform dedicated to modern data operations and pipeline reliability engineering.
Featured Snippet
What Is Data Quality in DataOps?
Data quality in DataOps is the practice of continuously validating, monitoring, and ensuring the accuracy, completeness, and reliability of data as it moves through automated pipelines. It shifts data testing “left” into the development lifecycle, using automated tooling to detect anomalies, schema changes, and failures before corrupt data impacts downstream business applications.
Understanding Data Quality in DataOps
What Is Data Quality?
Data quality represents the measure of how well a given dataset serves its intended business purpose across dimensions such as accuracy, completeness, consistency, and timeliness. In modern cloud architectures, data quality is not a static state but a continuous metric that fluctuates as data undergoes ingestion, transformation, and distribution.
What Is DataOps?
DataOps is an orchestration-focused, collaborative data management methodology designed to improve the speed, quality, and predictability of data analytics. It combines agile development practices, continuous integration/continuous deployment (CI/CD) pipelines, and rigorous statistical process control to manage the entire data lifecycle.
Why Data Quality Matters in DataOps Pipelines
In a legacy data ecosystem, validation was an after-the-fact batch process managed by data stewards. In an automated DataOps pipeline, data flows at high velocities from thousands of disparate sources. If bad data enters an automated pipeline, it propagates instantly through downstream models, BI tools, and API endpoints. High-velocity data pipelines require high-velocity automated data testing.
The Relationship Between Data Reliability and Business Success
Data reliability directly correlates with organizational agility and market performance. When data systems consistently deliver high-quality inputs, data scientists spend less time cleaning data and more time building predictive models. Business leaders gain the confidence to make rapid, data-backed decisions, turning data from an operational liability into a strategic competitive advantage.
In Simple Terms
Imagine a water treatment plant. DataOps is the automated system of pipes and pumps moving water from the river to the city. Data quality is the continuous testing system that checks the water for contaminants at every junction before it reaches anyone’s kitchen sink.
Real-World Example
A predictive logistics company processes millions of IoT sensor pings per minute to optimize delivery routes. By integrating automated schema validation into their ingestion pipelines, they instantly flag and quarantine malformed sensor payloads, preventing routing algorithms from sending delivery trucks off-course.
Common Mistake
Treating data quality as a one-time cleaning project at the end of the quarter rather than building continuous validation checks directly into the daily operational ingestion pipelines.
Key Takeaways
- Data quality is a dynamic operational metric, not a static state.
- DataOps provides the operational framework needed to scale automated quality checks.
- Reliable data infrastructure reduces development friction and boosts executive trust.
Core Dimensions of Data Quality
Accuracy
- Definition: The degree to which data correctly reflects the real-world objects or events it represents.
- Importance: Incorrect data leads to faulty insights and wrong business conclusions.
- Example: A customer’s address in the CRM exactly matches their current legal residence.
- Business Impact: High accuracy prevents costly misshipments and ensures targeted marketing campaigns reach the right audience.
Completeness
- Definition: The proportion of expected data that is explicitly present in the storage layer.
- Importance: Missing data values skew statistical models and create blind spots in operational reporting.
- Example: An e-commerce transaction record must contain a Customer ID, Product ID, Timestamp, and Total Amount.
- Business Impact: Complete transaction records ensure finance teams can reconcile accounts without manual audits.
Consistency
- Definition: The alignment of data values across different datasets, tables, or systems within the enterprise.
- Importance: Inconsistent data causes conflicting reports from different departments, paralyzing cross-functional operations.
- Example: An active employee’s start date is identical in both the HR portal database and the internal payroll system.
- Business Impact: Eliminates cross-departmental friction during annual budgeting and workforce planning sessions.
Timeliness
- Definition: The delay between when a real-world event occurs and when the corresponding data becomes available for consumption.
- Importance: Outdated data leads to late responses to changing market dynamics.
- Example: Financial transaction logs land in the analytics warehouse within 30 seconds of the swipe.
- Business Impact: Allows fraud detection algorithms to intercept stolen credit cards before transactions clear.
Validity
- Definition: The adherence of data values to predefined formats, types, lengths, or business rule constraints.
- Importance: Invalid formats cause database writes to fail and break downstream parsing scripts.
- Example: A United States zip code field contains exactly five or nine numeric digits.
- Business Impact: Ensures seamless integration with external third-party shipping APIs and validation services.
Uniqueness
- Definition: The constraint ensuring that no individual entity or event is recorded more than once in a dataset.
- Importance: Duplicate records artificially inflate metrics and lead to spamming customers.
- Example: Each customer record in the production database maps to one unique primary key UUID.
- Business Impact: Prevents sales representatives from sending duplicate marketing emails to the same account.
In Simple Terms
Think of the dimensions of data quality as a health scorecard for a patient. Accuracy is checking if the vital signs are correct; completeness is making sure no tests were skipped; consistency ensures the charts in different clinics match; and timeliness means you get the results today, not next year.
Real-World Example
A fintech application evaluates loan applications. If the applicant’s income field is missing (Completeness), formatted as text (Validity), or duplicates another application ID (Uniqueness), the pipeline automatically routes the application to a quarantine table for immediate review.
Common Mistake
Focusing exclusively on data accuracy while ignoring data timeliness, resulting in highly accurate dashboards that display data that is three weeks old.
Key Takeaways
- Data quality cannot be measured by a single metric; it spans six distinct core dimensions.
- Each dimension maps to specific technical constraints and tangible business outcomes.
- Automating checks across all dimensions is mandatory for scaled pipeline operations.
Common Data Quality Challenges
Missing Data
- Cause: Upstream system crashes, unannounced API payload updates, or optional form fields left blank by users.
- Impact: Missing fields break downstream machine learning models that expect complete feature arrays.
- Detection Methods: Run automated volumetric SQL checks to count null percentages across critical columns during staging.
Duplicate Records
- Cause: Network retry mechanisms firing multiple times during ingestion or poorly configured ETL merge joins.
- Impact: Artificially inflates transaction metrics, revenue totals, and active user counts in executive reports.
- Detection Methods: Implement strict unique key constraints and automate primary key frequency analysis inside the data warehouse.
Data Drift
- Cause: Shifts in underlying consumer behavior, seasonal trends, or changes to operational source configurations over time.
- Impact: Downstream statistical models lose predictive accuracy, leading to poor inventory or pricing decisions.
- Detection Methods: Use statistical profiling tools to track distribution metrics, such as mean, median, and variance, across incoming features.
Schema Changes
- Cause: Software engineering teams altering source database schemas (e.g., dropping columns, changing data types) without informing data teams.
- Impact: Downstream orchestration tasks crash instantly, halting morning reporting schedules.
- Detection Methods: Deploy automated schema validation checks at the ingestion layer using open-source validation frameworks.
Inconsistent Data Formats
- Cause: Merging regional operational databases that use different date formats, currencies, or naming conventions.
- Impact: Distorts global financial reporting and breaks string-parsing functions in transformation steps.
- Detection Methods: Apply regex validation rules and standardize incoming string patterns within staging tables.
ETL Failures
- Cause: Network dropouts, data warehouse resource starvation, or syntax bugs introduced in recent code deployments.
- Impact: Stale data sits in consumer-facing tables, leading to decisions based on outdated information.
- Detection Methods: Configure heartbeat monitors and orchestration alerts within active data pipelines.
Data Lineage Gaps
- Cause: Complex SQL views stacked upon legacy scripts without documentation or unified tracing tools.
- Impact: Debugging issues takes days because engineers cannot trace where a faulty metric originated.
- Detection Methods: Deploy automated data metadata harvesters to parse SQL logs and map end-to-end data relationships.
In Simple Terms
A data pipeline is like a long factory assembly line. Challenges like schema changes or missing data are like a supplier changing parts without telling the assembly line manager, causing the machinery to jam.
Real-World Example
A healthcare platform ingests patient records from dozens of regional clinics. A clinic updates its software, changing a date field from YYYY-MM-DD to DD/MM/YYYY. Without automated schema detection, the main transformation pipeline crashes, delaying critical patient analytics reports.
Common Mistake
Assuming source data structures will remain static forever, leaving pipelines vulnerable to unexpected upstream alterations.
Key Takeaways
- Upstream schema modifications and data drift are primary causes of pipeline downtime.
- Silent data corruption is often more damaging than outright pipeline failures.
- Catching errors early requires deploying automated validation checks directly at the ingestion boundary.
Why Traditional Data Quality Approaches Fall Short
Legacy data quality management relied heavily on manual data profiling, periodic spot checks, and siloed validation scripts written by individual database administrators. While this sufficed when data was structured and updated in nightly batch windows, it fails in today’s cloud architectures.
Manual Validation Limitations
Human review cannot scale alongside modern data volumes. By the time an analyst manually queries a table to verify a row count, millions of new records have streamed past, rendering the manual check obsolete.
Reactive Issue Detection
Traditional approaches are reactive. The data engineering team typically discovers an error only after an executive notices an impossible figure on a high-visibility dashboard. This forces engineers to spend their time firefighting problems after damage has been done.
Legacy Reactive Loop:
[Bad Data Injected] ──> [Dashboard Corrupted] ──> [Executive Complains] ──> [Manual Debugging]

Modern Proactive Loop:
[Bad Data Injected] ──> [Automated Test Fails] ──> [Pipeline Quarantined] ──> [Alert Dispatched]
Scaling Challenges
As an enterprise grows from managing dozens of tables to orchestrating thousands of distributed data assets across multiple cloud environments, maintaining ad-hoc validation scripts becomes impossible. The scripts become brittle, difficult to govern, and prone to breaking during platform migrations.
Lack of Real-Time Monitoring
Modern applications run on sub-second operational loops. Legacy data quality audits that run once a week leave companies blind to data corruption during the intervening six days, posing a major risk to real-time operations.
In Simple Terms
Using legacy data validation methods today is like trying to inspect every single bottle on a high-speed soda bottling line using a hand-held magnifying glass. You simply cannot keep up without automated sensors built into the conveyor belts.
Real-World Example
A global ride-sharing application processes billions of location coordinates daily. When they relied on traditional overnight batch validation checks, pricing errors caused by GPS anomalies persisted for hours, resulting in incorrect rider charges before engineers could identify the root cause.
Common Mistake
Relying on data consumers to flag data quality issues, which erodes trust in the data platform’s reliability.
Key Takeaways
- Manual validation cannot handle the scale, variety, and velocity of modern cloud data stacks.
- Reactive operations damage team credibility and slow down corporate decision-making.
- Modern environments require continuous, automated, and embedded data testing frameworks.
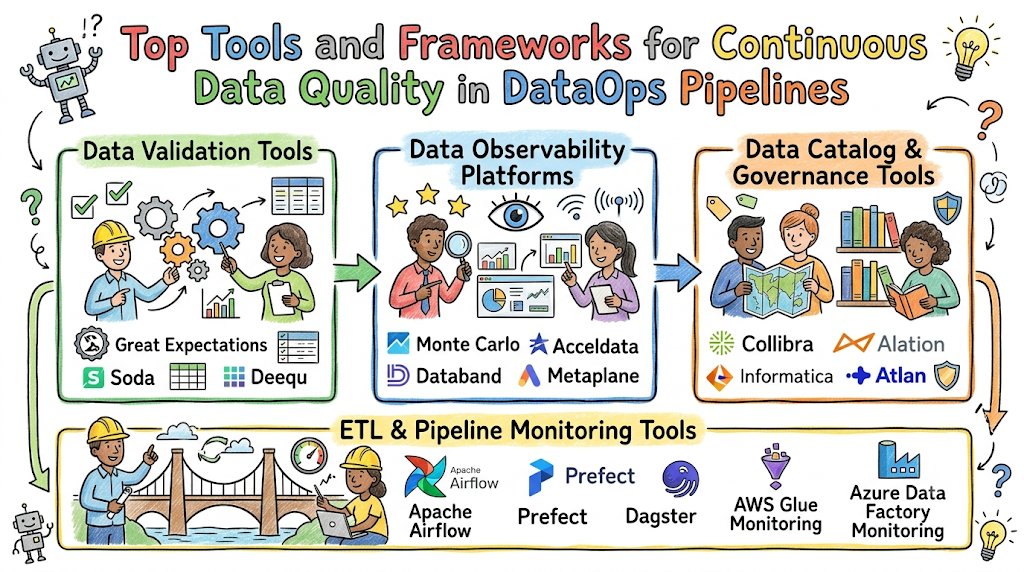
Essential Tools for Ensuring Data Quality in DataOps Pipelines
Data Validation Tools
Great Expectations
- Purpose: An open-source Python framework designed for parsing, testing, and documenting data assets.
- Key Features: Automated data profiling, human-readable assertion generation (“Expectations”), and native integration with execution engines like Spark, dbt, and Pandas.
- Advantages: It serves as a shared single source of truth for data validity, generating visual HTML documentation (“Data Docs”) automatically.
- Use Cases: Validating incoming S3 CSV files against strict schemas before running Snowflake transformation steps.
Soda
- Purpose: An enterprise-grade data monitoring and evaluation engine driven by a declarative language called SodaCL.
- Key Features: Human-readable YAML configuration files, cross-platform checks, and a centralized management platform for alerts.
- Advantages: Enables non-technical product managers to write complex data validation rules using plain text statements.
- Use Cases: Implementing inline validation steps inside continuous integration pipelines to catch breaking structural updates.
Deequ
- Purpose: An open-source library built on Apache Spark, developed and maintained by Amazon for analyzing data quality at scale.
- Key Features: Distributed data profiling, large-scale verification checks, and historical anomaly tracking across massive datasets.
- Advantages: Highly optimized for terabyte-scale processing architectures running on top of AWS EMR or Databricks clusters.
- Use Cases: Running daily data quality calculations on multi-billion row transactional lakes.
Data Observability Platforms
Monte Carlo
- Purpose: An end-to-end enterprise data observability platform providing automated anomaly detection across data stacks.
- Key Features: ML-driven data drift tracking, automated field-level lineage mapping, and out-of-the-box volume monitoring.
- Advantages: Requires zero configuration to start detecting anomalies, automatically learning data distribution profiles over time.
- Use Cases: Automatically alerting data platforms when an orchestration table ingests 50% fewer rows than its historical average.
Bigeye
- Purpose: An enterprise data observability tool focused on tracking data metrics and preventing silent data corruption.
- Key Features: Automated recommendations for data quality thresholds, SLA tracking, and root-cause analysis workbenches.
- Advantages: Simplifies identifying which upstream columns caused a downstream metric anomaly.
- Use Cases: Protecting executive financial dashboards from subtle data drift issues across deep table hierarchies.
Databand
- Purpose: An orchestration-centric data observability solution owned by IBM, tailored for pipeline execution tracking.
- Key Features: Deep runtime tracking for Apache Airflow, dataset impact analysis, and execution log parsing.
- Advantages: Ties data health directly to pipeline execution health, simplifying debugging for engineering teams.
- Use Cases: Pinpointing exactly which Airflow task failure caused a downstream data quality gap.
Acceldata
- Purpose: A comprehensive data platform observability tool built for hybrid and multi-cloud data operations.
- Key Features: Compute resource cost optimization, operational pipeline performance tracking, and data quality assurance.
- Advantages: Connects data quality issues directly to physical compute performance and operational costs.
- Use Cases: Optimizing large scale Databricks and Snowflake operations alongside data health initiatives.
Metaplane
- Purpose: A developer-focused data observability platform built for fast implementation across modern data stacks.
- Key Features: Automated slack alerting, quick database integrations, and downstream BI tool dependency mapping.
- Advantages: Highly intuitive user interface that allows small engineering teams to configure observability within minutes.
- Use Cases: Providing real-time alerts to Looker and Tableau users when underlying data infrastructure experiences lag.
Data Catalog and Governance Tools
Collibra
- Purpose: An enterprise-scale data governance platform that organizes business definitions and provides clear visibility into data lineages.
- Key Features: Business glossary management, data lineage mapping, and automated governance workflow routing.
- Advantages: Provides a centralized system of record for compliance, access rules, and data definitions across large enterprises.
- Use Cases: Mapping data lineage across multiple business units to ensure GDPR compliance.
Alation
- Purpose: A data catalog designed to help users find, understand, and trust enterprise information assets.
- Key Features: Intelligent data stewardship flags, natural language searching, and automated query behavior analysis.
- Advantages: Features an intuitive interface that encourages collaboration between technical data engineers and business analysts.
- Use Cases: Helping self-service business analysts locate verified, high-quality gold tables within a data lakehouse.
Informatica
- Purpose: A cloud data management platform offering master data governance and metadata cataloging.
- Key Features: Automated metadata discovery, cross-cloud lineage generation, and centralized policy enforcement engines.
- Advantages: Highly mature architecture equipped to handle complex legacy environments alongside modern cloud environments.
- Use Cases: Managing complex master data governance frameworks across legacy mainframes and modern cloud warehouses.
Atlan
- Purpose: A modern, collaboration-first data catalog designed for agile data teams.
- Key Features: Native Slack and Jira integrations, active metadata collection, and embedded data quality scores.
- Advantages: Seamlessly integrates into daily engineering workflows, bringing catalog data directly into developer tools.
- Use Cases: Showing active data quality scores directly to analysts inside their dbt documentation portals.
ETL and Pipeline Monitoring Tools
Apache Airflow
- Purpose: The open-source standard for orchestrating programmatic workflows and complex data pipelines.
- Key Features: Directed Acyclic Graph (DAG) definitions written in Python, robust provider integrations, and highly flexible execution options.
- Advantages: Highly customizable framework backed by a large global community.
- Use Cases: Orchestrating multi-tiered ETL processes that execute Great Expectations tasks between staging steps.
Prefect
- Purpose: A modern programmatic workflow orchestrator built to handle dynamic, real-time data processes.
- Key Features: Native Python code decoration, dynamic task mapping, and a developer-friendly UI.
- Advantages: Eliminates rigid boilerplate requirements, making it simple to build dynamic data quality conditional paths.
- Use Cases: Deploying real-time event-driven workflows that validate streaming data on the fly.
Dagster
- Purpose: An asset-focused data orchestrator built specifically for developing, testing, and operating data assets.
- Key Features: Native software-defined asset tracking, local execution simulation capabilities, and integrated data quality logging.
- Advantages: Shifts focus from simple operational tasks to the actual data assets produced, natively tracking data quality outputs.
- Use Cases: Building advanced lakehouse architectures where every step outputs verified, type-checked assets.
AWS Glue Monitoring
- Purpose: A managed monitoring solution for AWS Glue serverless ETL environments.
- Key Features: CloudWatch integration, real-time compute metrics, and automated data quality metric generation.
- Advantages: Native serverless scaling inside the Amazon Web Services catalog without operational overhead.
- Use Cases: Auditing data quality metrics for massive serverless Spark transformations within an AWS data lake.
Azure Data Factory Monitoring
- Purpose: The operational management interface for Microsoft Azure’s cloud integration service.
- Key Features: Visual pipeline alerts, native Log Analytics integration, and comprehensive execution diagnostics.
- Advantages: Delivers a visual management environment tailored for complex enterprise architectures on Azure.
- Use Cases: Monitoring complex hybrid data ingestions traveling from on-premise SQL instances to Azure Synapse.
Cloud-Native Data Quality Solutions
Snowflake Data Quality Features
- Purpose: Embedded data metric functions and validation checks native to the Snowflake Data Cloud platform.
- Key Features: Built-in system tags, declarative data metric functions, and automated alert routing schedules.
- Advantages: Runs natively within the storage layer, eliminating the need to move data out of the security perimeter for validation.
- Use Cases: Monitoring data freshness and null-value distributions directly inside critical production schemas.
Google Cloud Data Quality Services
- Purpose: Managed quality evaluation capabilities built directly into Dataplex and BigQuery.
- Key Features: Automated data profiling engines, serverless execution rules, and looker dashboard integrations.
- Advantages: Integrates with the Google Cloud data stack, processing petabyte-scale validation requests without infrastructure provisioning.
- Use Cases: Monitoring the quality of streaming ingestion pipelines feeding BigQuery core tables.
AWS Data Quality Services
- Purpose: Automated validation features integrated within AWS Glue Data Quality and Macie platforms.
- Key Features: Machine learning-generated data rules, continuous schema validation, and event-driven remediation.
- Advantages: Leverages DeeQu under the hood while offering a simplified, code-free configuration console.
- Use Cases: Automatically scanning incoming S3 storage buckets for schema changes and sensitive PII data.
Microsoft Fabric Data Monitoring
- Purpose: A unified analytics monitoring solution designed for the Microsoft Fabric SaaS data environment.
- Key Features: OneLake data hub monitoring, automated pipeline alerts, and end-to-end telemetry displays.
- Advantages: Consolidates data monitoring across Power BI, Synapse, and Data Factory into a single view.
- Use Cases: Managing governance and pipeline tracking across all corporate departments from a central console.
In Simple Terms
Selecting data tools is like equipping a commercial security team. Data validation tools act like security guards checking IDs at the entrance; data observability works like automated security cameras watching for unusual activity; and data catalogs function like an inventory ledger tracking where assets are stored.
Real-World Example
An enterprise migration team shifts legacy on-premise data to a Snowflake Lakehouse. They use Great Expectations to enforce schemas at ingestion, Monte Carlo to observe anomalies across internal schemas, and Atlan to expose clear lineage to business users, reducing migration downtime to zero.
Common Mistake
Deploying multiple specialized monitoring tools across the stack without a central alerting strategy, leading to alert fatigue and missed incident notifications.
Key Takeaways
- Data validation engines require explicit user configuration to verify known business rules.
- Data observability platforms use machine learning to detect unexpected operational anomalies.
- Cloud-native built-in features reduce architectural complexity by keeping validation checks close to the data storage layer.
Data Quality Tools Comparison
| Tool Name | Category | Key Strength | Best For | Difficulty Level |
| Great Expectations | Data Validation | Open-source flexibility, detailed auto-generated data documentation. | Python-centric data teams and dbt workflows. | Medium |
| Soda | Data Validation | Plain-text declarative check writing syntax (SodaCL). | Cross-functional engineering and product alignment. | Low |
| Deequ | Data Validation | Optimized distributed computing at scale. | Massive petabyte Spark-based data lakes. | High |
| Monte Carlo | Data Observability | Machine learning anomaly detection with zero setup. | Enterprise-wide automated pipeline tracking. | Low |
| Metaplane | Data Observability | Rapid deployment and down-to-dashboard lineage. | Lean, fast-growing data teams. | Low |
| Dagster | ETL Orchestration | Native software-defined asset quality tracking. | Modern code-first analytics engineering infrastructure. | High |
| Atlan | Catalog & Governance | Highly collaborative interface with deep tool integrations. | Teams looking to unify governance with engineering. | Medium |
Data Observability vs Traditional Monitoring
| Capability | Traditional Monitoring | Data Observability |
| Visibility | Evaluates explicit system metrics (e.g., CPU load, disk usage, simple row checks). | Provides deep contextual visibility across data values, metrics, and business logical outputs. |
| Root Cause Analysis | Requires manual parsing of server logs and isolated query testing. | Automatically maps lineage to pinpoint the exact upstream table causing the issue. |
| Anomaly Detection | Relies on hard-coded static thresholds manually set by engineers. | Uses machine learning models to dynamically track distribution changes and drift. |
| Lineage Tracking | Absent or maintained manually via wiki documentation pages. | Automatically mapped in real time by harvesting metadata logs across systems. |
| Proactive Detection | Minimal; typically flags errors after processing completes or pipelines crash. | Flags emerging trends and data anomalies before they disrupt downstream layers. |
| Scalability | Becomes fragile and difficult to maintain as tables multiply. | Scales efficiently across millions of assets using automated metadata scraping. |
Building a Data Quality Framework in DataOps
Implementing a reliable DataOps data quality framework requires a structured, multi-step implementation roadmap. Follow this architecture plan to deploy continuous validation across your data environment:
[Define SLAs] ──> [Embed Inline Tests] ──> [Map Lineage] ──> [Deploy Observability] ──> [Alert Routing]
1. Define Data Quality Standards (SLAs)
Collaborate with business stakeholders to define strict Service Level Agreements (SLAs) and Service Level Objectives (SLOs) for data assets. Document explicit parameters for table freshness, maximum acceptable null value ratios, and required schema validation rules.
2. Implement Automated Testing (Shift-Left)
Embed programmatic data validation checks directly into the continuous integration (CI/CD) and orchestration layers. Every ingestion routine should route incoming records through a staging layer where basic formatting, primary key uniqueness, and null constraint tests run before data merges into production environments.
3. Establish Data Lineage
Deploy automated lineage harvesting tools to trace the flow of data from its source to final consumption endpoints. This structural map allows the platform to perform instant impact analysis when an upstream component fails.
4. Continuous Monitoring and Observability
Configure machine learning-driven observability engines across production repositories. These engines monitor variations in data volumes, schema shifts, and internal data distributions, establishing baseline behavior patterns without requiring manual threshold adjustments.
5. Incident Management for Data Issues
Establish clear incident management protocols when data tests fail. Introduce automated routing rules that quarantine corrupted records in specialized isolation tables, create tracking tickets in platforms like Jira, and notify on-duty engineers via communication loops like PagerDuty or Slack.
6. Feedback Loops and Iterative Refinement
Conduct structured post-mortem evaluations after critical data incidents to discover the root cause of the breakdown. Use these insights to update your validation rules, ensuring the same issue cannot bypass your automated gates in the future.
In Simple Terms
Building a data quality framework is like setting up a modern airport security system. You establish clear regulations (SLAs), set up luggage scanners at the entrance gates (Automated Testing), map passenger routes (Lineage), use security cameras (Observability), and create holding areas for suspicious baggage (Incident Management).
Real-World Example
A digital streaming platform implements this framework using Dagster and Great Expectations. When a streaming media payload arrives with missing user identifiers, the pipeline isolates the bad batch in a quarantine zone, alerts the engineering team on Slack, and continues processing clean records uninterrupted.
Common Mistake
Configuring aggressive alerting configurations on unverified data distributions, resulting in alert fatigue that leads engineers to ignore critical notifications.
Key Takeaways
- A robust data framework combines explicit test assertions with automated machine learning observability.
- Quarantining malformed records allows pipelines to remain operational while isolating bad data.
- Post-mortem tracking loops are essential for continuously improving validation coverage.
Real-World Use Cases
E-Commerce Analytics
- Data Challenge: A global retailer integrated multiple regional point-of-sale systems, which frequently led to duplicate transaction IDs, varying currency schemas, and missing customer records in the central warehouse.
- Tool Implementation: The team deployed Soda to validate incoming regional batches against strict format rules and configured Monte Carlo to track distribution drift.
- Business Outcome: Erroneous revenue inflation dropped to zero, and executive leadership regained confidence in daily regional performance metrics.
Banking and Financial Reporting
- Data Challenge: A financial institution faced strict regulatory compliance audits, but legacy SQL procedures regularly caused silent transformation errors that corrupted asset values in regulatory reports.
- Tool Implementation: They migrated execution steps to Dagster for clear visibility into software-defined data assets and embedded Great Expectations gates at every intermediate stage.
- Business Outcome: The institution passed internal regulatory audits with zero data integrity flags and reduced audit compilation timelines by 40%.
Healthcare Data Platforms
- Data Challenge: A medical analytics platform integrated streaming patient data from various regional hospital EHR formats, frequently encountering unexpected schema changes that broke downstream reporting dashboards.
- Tool Implementation: The platform deployed AWS Glue Data Quality tools to validate incoming payloads and used Atlan to maintain an active data catalog.
- Business Outcome: Prevented pipeline crashes caused by unexpected schema updates, ensuring clinicians received reliable patient insights without operational delays.
SaaS Product Analytics
- Data Challenge: A B2B software provider tracked product engagement metrics across millions of daily user sessions, but frequent application updates regularly broke telemetry event schemas, distorting key engagement metrics.
- Tool Implementation: The engineering team integrated Metaplane directly into their Snowflake and dbt environments, connecting alerts straight to their engineering Slack channels.
- Business Outcome: Reduced the average time to detect telemetry disruptions from two weeks to under ten minutes, keeping product feature adoption reports accurate.
Supply Chain Analytics
- Data Challenge: An international logistics enterprise faced data latency and missing tracking data from global maritime shipping transponders, which caused predictive arrival models to generate inaccurate estimates.
- Tool Implementation: They deployed Deequ on an Amazon EMR Spark cluster to analyze high-volume streaming telemetry and track missing data metrics in real time.
- Business Outcome: Improved ETA prediction accuracy by 25%, allowing regional distribution hubs to optimize warehouse labor schedules.
Best Practices for Maintaining Data Quality
- Shift-Left Data Testing: Run automated validation checks as early in the data lifecycle as possible. Catching errors at the ingestion stage prevents bad data from corrupting downstream models and analytical views.
- Automate Validation Rules: Avoid relying on manual testing. Use frameworks like Great Expectations or Soda to run assertions automatically on every new data batch.
- Monitor Data Continuously: Deploy machine learning-driven observability platforms to continuously track metrics like freshness, volume, and schema drift without needing manual rule configuration.
- Track Data Lineage: Maintain an up-to-date map of data dependencies across your stack. This ensures you can quickly perform impact analysis and trace data errors back to their upstream source.
- Improve Collaboration Between Teams: Use data contracts to establish clear agreements between the software engineers who produce data and the data teams who consume it.
- Measure Data Quality KPIs: Track key operational metrics, such as data completeness scores, average time-to-detect (TTD) incidents, and pipeline uptime, to evaluate the health of your data ecosystem.
Common Mistakes Organizations Make
Relying Only on Manual Checks
- Consequence: Data teams become bottlenecked by manual spot-checks, allowing silent data corruption to slip through to production dashboards unnoticed.
- Solution: Replace manual validation with automated, code-driven testing frameworks integrated into your CI/CD pipelines.
Ignoring Metadata
- Consequence: Engineers miss out on valuable operational context, such as schema history and system logs, making root-cause analysis slow and inefficient.
- Solution: Use automated tools to continuously harvest and analyze metadata, turning it into actionable lineage maps and observability insights.
Lack of Ownership
- Consequence: When data issues occur, resolution is delayed because software developers, data engineers, and business analysts all assume someone else is responsible for the fix.
- Solution: Establish clear data contracts and define explicit domain ownership for every data asset across the organization.
Poor Documentation
- Consequence: Knowledge becomes trapped within individual teams, forcing engineers to spend hours reverse-engineering undocumented pipeline logic to fix data issues.
- Solution: Use tools that automatically generate human-readable data documentation, such as Great Expectations Data Docs, as part of your deployment process.
Delayed Issue Resolution
- Consequence: Corrupted data sits in production tables for days, damaging downstream applications and eroding business users’ trust in the data platform.
- Solution: Set up automated incident routing workflows that send real-time alerts to the on-call engineering team via Slack or PagerDuty the moment a data test fails.
Measuring Data Quality Success (KPI Framework)
To evaluate the impact of your DataOps quality initiative, track this comprehensive framework of key performance indicators (KPIs) within an operational engineering dashboard:
┌────────────────────────────────────────────────────────┐
│               DATAOPS QUALITY KPI DASHBOARD            │
├───────────────────────────┬────────────────────────────┤
│  Data Accuracy Rate       │  Incident Frequency        │
│  99.8% (Target: >99.5%)   │  2 / Month (Dropped 80%)   │
├───────────────────────────┼────────────────────────────┤
│  Data Freshness (SLA)     │  Mean Time to Detect (MTTD)│
│  14 mins (Target: <30m)   │  8 mins (Target: <15mins)  │
├───────────────────────────┼────────────────────────────┤
│  Data Completeness Score  │  User Trust Score          │
│  99.9% (Target: >99.0%)   │  4.7 / 5.0 (Up from 3.1)   │
└───────────────────────────┴────────────────────────────┘
Data Accuracy Rate
- Metric Formulation:$$\text{Accuracy Rate} = \left( \frac{\text{Total Validated Records} – \text{Identified Erroneous Records}}{\text{Total Validated Records}} \right) \times 100$$
- Target Metric Benchmark: $> 99.5\%$ accuracy across production gold-tier core tables.
Data Freshness
- Metric Formulation:$$\text{Freshness Lag} = \text{Timestamp of Evaluation} – \text{Timestamp of Last Successful Record Update}$$
- Target Metric Benchmark: Less than 30 minutes for operational tables; under 30 seconds for real-time streaming ingestion layers.
Pipeline Reliability
- Metric Formulation:$$\text{Pipeline Reliability} = \left( \frac{\text{Successful Execution Runs}}{\text{Total Configured Schedule Execution Runs}} \right) \times 100$$
- Target Metric Benchmark: $> 99.9\%$ uptime across critical production orchestration schedules.
Incident Frequency
- Metric Formulation: Total number of high-severity data data incidents flagged within a 30-day operational window.
- Target Metric Benchmark: Steady downward trend, aiming for fewer than two critical severity business data disruptions per month.
Data Completeness
- Metric Formulation:$$\text{Completeness Score} = \left( \frac{\text{Dataset Rows with Non-Null Required Fields}}{\text{Total Rows Ingested within Target Window}} \right) \times 100$$
- Target Metric Benchmark: $> 99.9\%$ completeness for primary key identifiers and required regulatory transaction fields.
User Trust Metrics
- Metric Formulation: Semi-annual internal surveys measuring data consumer confidence scores on a 1-5 scale, combined with tracking the reduction in ad-hoc Slack data complaints.
- Target Metric Benchmark: An organizational satisfaction score of $> 4.5 / 5.0$ across active internal business analyst cohorts.
Career Opportunities in Data Quality and DataOps
The shift toward reliable data engineering has created a surge in high-paying specialized roles within enterprise technology organizations.
DataOps Engineer
- Core Responsibilities: Building and maintaining automated CI/CD deployment setups, orchestration structures, and infrastructure monitoring loops for data operations.
- Required Skills: Expertise in Docker, Kubernetes, Apache Airflow, Python, and cloud infrastructure platforms (AWS/GCP/Azure).
Data Quality Analyst
- Core Responsibilities: Partnering with business stakeholders to define data quality metrics, writing explicit test cases, and managing data issue tracking lifecycles.
- Required Skills: Advanced SQL capabilities, experience with data profiling tools, and strong cross-functional communication skills.
Data Governance Specialist
- Core Responsibilities: Developing data usage policies, managing enterprise business glossaries, and tracking compliance across data systems.
- Required Skills: Familiarity with data privacy regulations (GDPR/CCPA) and experience managing enterprise tools like Collibra or Alation.
Analytics Engineer
- Core Responsibilities: Developing clean, well-tested data transformation models that bridge the gap between raw data pipelines and business analysis layers.
- Required Skills: Advanced dbt, expert SQL engineering, version control workflows, and data warehousing experience (Snowflake/BigQuery).
Data Reliability Engineer (DRE)
- Core Responsibilities: Applying site reliability engineering (SRE) principles to data platforms, focusing on maximizing data uptime, tracking SLAs, and minimizing incident resolution times.
- Required Skills: Deep expertise in data observability platforms, automated pipeline remediation, and advanced performance tuning for distributed compute systems.
Learning Roadmap for Data Quality Engineering:
[Advanced SQL/Python] ──> [dbt Transformation] ──> [Orchestration (Airflow)] ──> [Observability Frameworks]
Future of Data Quality in DataOps
The field of data quality management is evolving rapidly, moving away from manual, rule-based systems toward intelligent, automated architectures.
AI-Powered Data Quality Monitoring
Modern data suites are increasingly integrating machine learning models that automatically generate validation assertions based on historical data patterns. This reduces the need for engineers to manually write and maintain thousands of static validation rules.
Automated Root Cause Analysis
Future data platforms will do more than just alert teams to anomalies; they will automatically trace issues across end-to-end lineage networks. By analyzing code changes and data flows simultaneously, these systems can pinpoint the exact line of code or upstream source responsible for a data issue.
Self-Healing Data Pipelines
As orchestration engines become tighter integrated with data observability platforms, pipelines are beginning to self-heal. If a system detects an anomaly caused by an API format change, it can automatically apply a dynamically generated schema patch or route the affected records to an isolated quarantine area while continuing to process clean data unaffected.
Self-Healing Pipeline Flow:
[Anomaly Detected] ──> [Dynamic Schema Patch Applied] ──> [Data Restored] ──> [Log Dispatched]
Data Reliability Engineering (DRE)
Organizations are increasingly treating data health with the same rigor as software platform uptime. This has driven the adoption of Data Reliability Engineering (DRE) teams, who focus exclusively on monitoring data SLAs, reducing incident resolution times, and managing operational data infrastructure.
In Simple Terms
The future of data quality is like moving from a manual car dashboard where you have to check the oil yourself to a self-driving vehicle that monitors its own engine, fixes minor issues on the fly, and schedules its own maintenance without you ever lifting a finger.
Real-World Example
An enterprise healthcare system uses advanced anomaly detection engines to monitor patient intake data. When a clinic updates its software and shifts a data schema, the pipeline automatically detects the change, updates its internal transformation mapping, and processes the records without a single minute of system downtime.
Common Mistake
Waiting for automated AI tooling to become flawless before implementing basic validation checks, leaving pipelines unprotected in the meantime.
Key Takeaways
- Machine learning models are replacing manual, static validation rules with dynamic threshold monitoring.
- Automated root-cause analysis significantly reduces the time it takes to debug complex data pipeline issues.
- The rise of Data Reliability Engineering highlights the growing importance of treating data health like software platform uptime.
Case Study Section
Case Study 1: E-Commerce Customer Data Quality Project
- Problem: A multi-national e-commerce retailer experienced severe data fragmentation across its customer profile systems. This caused marketing automation platforms to send duplicate promotion tracks to users, resulting in high customer unsubscribes and flawed user retention reports.
- Data Quality Issue: Primary key duplication combined with inconsistent name and address capitalization formats from regional checkout apps.
- Tool Implementation: The engineering team configured Soda to enforce format consistency checks and uniqueness tests on incoming user registration streams before they merged into the core customer tables in Snowflake.
- Outcome: Duplicate customer profiles dropped by 92% within the first month, marketing spend efficiency increased by 14%, and user retention metrics became fully accurate.
- Lessons Learned: Validating primary key structures at the ingestion point is far more efficient than attempting to deduplicate records after they have already merged into production tables.
Case Study 2: Banking Regulatory Reporting Pipeline
- Problem: A commercial banking institution faced recurring financial penalties from compliance regulators because of late and inaccurate quarterly risk exposure reporting.
- Data Quality Issue: Transformation scripts frequently encountered null balances and mismatched currency definitions, causing overnight batch procedures to fail silently.
- Tool Implementation: The data platform team redesigned their ingestion pipelines around Dagster and embedded strict validation gates using Great Expectations at every transactional intersection.
- Outcome: Pipeline processing failures were eliminated, compliance reports were delivered to regulators five days ahead of schedule, and the bank avoided multi-million dollar regulatory penalties.
- Lessons Learned: Clear visibility into data lineage and software-defined assets is essential for passing rigorous regulatory data audits.
Case Study 3: Healthcare Analytics Platform
- Problem: A health tech provider’s diagnostic optimization platform started generating inconsistent patient risk assessments, eroding doctors’ trust in the system’s clinical recommendations.
- Data Quality Issue: Subtle data drift occurred when regional lab equipment providers updated their software, altering measurement scale metrics without changing the underlying schema labels.
- Tool Implementation: The engineering team deployed Monte Carlo to continuously monitor data distributions and flag statistical drift across incoming lab measurements.
- Outcome: The platform detected two major data drift incidents within days of deployment, allowing engineers to recalibrate transformation models before incorrect metrics reached clinical dashboards.
- Lessons Learned: Relying only on static schema checks is not enough; tracking data distribution variations is critical for protecting downstream machine learning models.
FAQ Section
What is data quality in DataOps?
Data quality in DataOps is the practice of continuously monitoring and validating data assets across automated production pipelines. It focuses on catching data errors early in the development lifecycle using automated testing frameworks.
Why is data quality important?
High data quality ensures that business decisions, automated processes, and machine learning models are based on reliable inputs. This reduces operational costs, protects organizations from regulatory penalties, and builds trust across analytics teams.
What are the best data quality tools?
Popular tools include Great Expectations and Soda for data validation, Monte Carlo and Metaplane for automated data observability, and Dagster and Apache Airflow for managing and monitoring pipeline orchestration.
What is data observability?
Data observability is the practice of monitoring the health and internal state of data systems by tracking metadata, volumes, lineage patterns, and statistical drift using automated machine learning models.
How does Great Expectations work?
Great Expectations allows engineering teams to write explicit, declarative assertions (“Expectations”) about their data. It runs these tests against datasets during pipeline execution and automatically generates human-readable documentation based on the results.
What KPIs measure data quality?
Key performance indicators include data accuracy rates, pipeline processing freshness against SLAs, completeness scores across key columns, incident frequency, and average mean-time-to-detect (MTTD) data issues.
How do organizations detect data drift?
Organizations use statistical profiling engines to track changes in data distributions (such as mean, median, and variance) over time, alerting teams when incoming data deviates from historical baselines.
What is the difference between data governance and data quality?
Data governance defines the high-level policies, ownership structure, security access rules, and business meanings for data assets. Data quality focuses on the technical implementation, testing, and continuous monitoring needed to ensure data remains accurate and reliable.
Can small teams implement DataOps quality practices?
Yes, small teams can implement DataOps practices by starting with lightweight, developer-friendly platforms like Metaplane or Soda coupled with modern transformation tools like dbt to automate baseline validation rules.
What is a self-healing data pipeline?
A self-healing pipeline is an advanced architecture that uses automated monitoring to detect data anomalies and automatically applies programmatic fixes, such as schema updates or routing bad data to quarantine, without requiring human intervention.
How do data contracts improve pipeline reliability?
Data contracts establish explicit agreements between the software developers who generate data and the data engineers who consume it, ensuring that upstream application changes do not unexpectedly break downstream data pipelines.
What is shift-left data testing?
Shift-left data testing means running automated validation checks as early as possible in the data lifecycle—such as at the ingestion boundary—rather than waiting to test data after it reaches the data warehouse.
What causes data lineage gaps?
Lineage gaps are typically caused by untracked ad-hoc queries, complex legacy store procedures, or using siloed data tools that do not share metadata logs with centralized cataloging systems.
How does alert fatigue affect data teams?
Alert fatigue occurs when monitoring systems are configured with overly sensitive thresholds, causing engineers to be flooded with minor or false notifications, which often leads them to overlook critical system failures.
What role does a Data Reliability Engineer play?
A Data Reliability Engineer (DRE) applies site reliability engineering principles to data infrastructure, focusing on maximizing data freshness, ensuring high platform uptime, and reducing the time it takes to resolve data incidents.
Final Summary
Maintaining high-quality, reliable data is a foundational requirement for any successful modern analytics enterprise. By implementing DataOps principles, organizations can transition away from legacy, manual validation methods and adopt automated, continuous testing frameworks that scale alongside their infrastructure. Leveraging modern tools—including validation engines like Great Expectations, observability platforms like Monte Carlo, and orchestration tools like Dagster—allows data teams to proactively identify and resolve anomalies before they impact downstream applications.