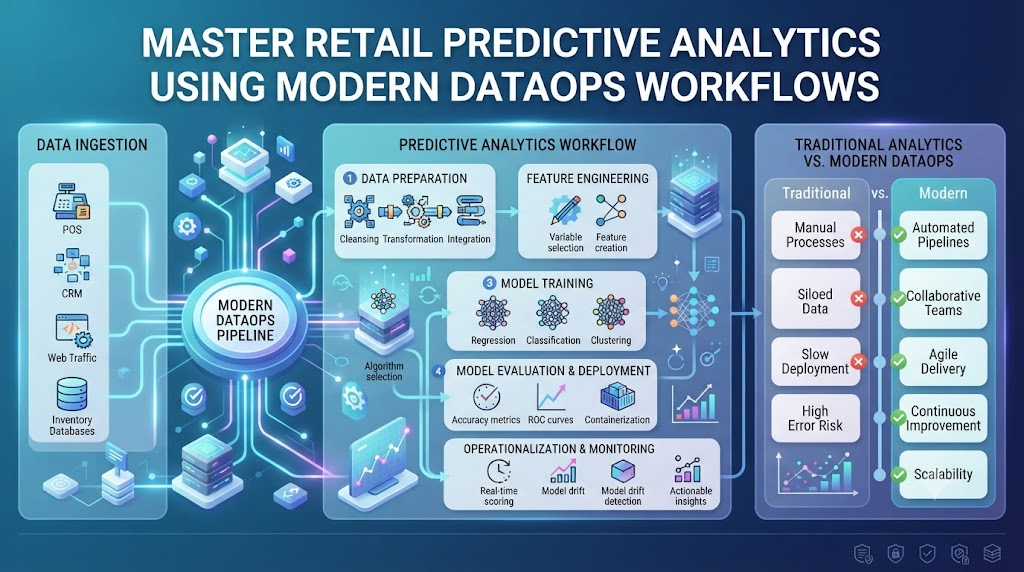
Retail stores face constant pressure to guess what buyers want next week. When shelves go empty, shoppers leave and buy elsewhere. When warehouses hold too much stock, cash gets trapped and profits shrink fast. You need reliable data models to predict exact customer demand. Traditional data pipelines often break quietly, feeding bad numbers into your sales forecasts. That is why smart teams turn to operational data practices found at TheDataOps.org to build trust in every single retail number. We will show you how to blend predictive analytics with robust data pipelines. You will learn how to catch broken code before it ruins your inventory counts. Your team can automate testing, track pipeline health, and deliver sharp sales forecasts every single morning. Let us explore how you can transform messy retail data into reliable business growth.
Understanding Retail Predictive Analytics Basics
What is predictive analytics in retail? It is the art of using past sales records to forecast future buying patterns. You look at seasonal trends, local weather updates, and past holiday surges. You feed these numbers into machine learning models to predict future demand. But these models fail when underlying data feeds break or change unexpectedly. A single missing column in your sales database can crash your entire stock forecast. That is why raw predictive models are never enough on their own. You need a reliable framework to build, test, and ship these models safely. Data operations bring software engineering rigor directly into your data workflows. You track every code change, test every data table, and monitor live model performance continuously.
The Core Pillars of Retail Data Operations
Data operations stand on three main pillars: automation, collaboration, and continuous testing. Automation removes manual chores that lead to human errors. You write scripts to pull inventory logs and clean customer logs automatically. Collaboration ensures data engineers, store managers, and data scientists talk to each other. When a store manager spots a sudden spike in winter coat sales, the data engineer updates the ingestion script. Continuous testing acts as your safety net against bad data drops. Every time a vendor sends a new inventory file, automated tests check its structure. If a price field contains negative numbers, the pipeline stops instantly before ruining your dashboards.
Designing Resilient Data Pipelines for Store Inventories
Your predictive models rely completely on clean, fresh inventory data. If your data pipeline lags, your sales forecasts become obsolete before you even read them. You must design pipelines that handle high data volumes without slowing down store operations. Start by breaking massive data loads into smaller, manageable chunks. Use incremental data loading so you only process new transactions instead of scanning entire databases. Implement robust error handling so temporary network drops do not crash your pipeline. When a connection fails, the system should retry automatically after a short pause. You also need clear logging so you can trace any data issue back to its exact source.
Managing Data Drift in Retail Demand Models
Consumer habits shift rapidly based on economic trends, local events, and viral social media posts. When consumer behavior changes, your predictive models begin to make costly errors. This problem is known as data drift, and it can quietly destroy your profit margins. You must monitor your models every single day to catch performance drops early. Compare your predicted sales numbers against actual store receipts each week. If the error rate rises above a safe threshold, trigger an automated alert. Retrain your models using fresh data to capture the latest shopping trends. Keeping your models up to date ensures your shelves stay stocked with the exact items buyers want.
Scaling Feature Stores for Omnichannel Retailers
Omnichannel retailers collect customer data from online apps, mobile checkouts, and physical brick-and-mortar stores. Managing these scattered data points causes massive headaches for data science teams. A centralized feature store solves this problem by organizing all customer data in one place. It stores clean, reusable data points like average purchase size and preferred checkout times. Your data scientists can pull these features instantly without writing duplicate data cleaning scripts. This speeds up model building and ensures online and offline channels use identical metrics. A good feature store keeps your predictive analytics consistent across every single customer touchpoint.
Automating Data Quality Checks in Daily Operations
Bad data ruins retail forecasts faster than almost any other technical issue. You cannot rely on manual spreadsheet checks to catch broken data feeds. You need automated tests that run silently behind the scenes every single hour. Check for missing product IDs, duplicate customer records, and sudden drops in daily transaction counts. If transaction counts drop by fifty percent on a busy Saturday, send an immediate alert. Automated testing saves your engineering team hours of stressful debugging. It builds deep trust across your retail organization because managers know your numbers are always correct.
Bridging the Gap Between Data Teams and Store Managers
Technical data teams often build complex forecasting models that store managers struggle to understand. Store managers need simple, actionable insights rather than confusing statistical charts. You must translate complex model outputs into clear inventory action plans. For example, tell the manager to order fifty extra winter jackets rather than sharing model accuracy scores. Involve store managers early when you design new predictive analytics tools. Ask them what local factors influence sales in their specific neighborhood stores. When store teams help build the tool, they trust its outputs and use them to optimize local stock levels.
Measuring ROI and Business Impact of Data Operations
Implementing operational data practices requires time, money, and dedicated engineering effort. Company leaders will naturally ask about the financial return on this investment. You must track key performance indicators to prove the value of your data pipeline upgrades. Measure how much less time your engineers spend fixing broken data pipelines each week. Track the reduction in stockouts and overstock waste across your retail warehouse network. Lower inventory holding costs and higher sales conversion rates provide clear proof of success. Share these winning metrics with company executives to secure ongoing support for your data projects.
Real-World Case Studies on Retail Data Failures
- The Black Friday Database Lock: A major clothing retailer suffered a database crash at noon on Black Friday because too many point-of-sale terminals wrote transaction logs simultaneously, but implementing automated connection pooling and rate limiting prevented repeat crashes the following year.
- The Phantom Inventory Glitch: An online electronics store shipped hundreds of non-existent laptops because an unmonitored data pipeline skipped error handling, but adding automated schema validation tests permanently caught missing inventory rows before they reached the warehouse system.
- The Midnight Weather Pipeline Failure: A grocery chain lost its daily stock delivery forecasts when an automated FTP script failed silently at midnight, but setting up proactive pager alerts for pipeline timeouts allowed the engineering team to fix the connection before morning opening.
- The Duplicate Transaction Storm: A home goods retailer experienced corrupted customer purchase history models when a retried API call duplicated every transaction record, but introducing idempotent database write scripts ensured duplicate entries were automatically ignored.
- The Cloud Storage Cost Spike: A regional shoe retailer received a massive cloud infrastructure bill because a rogue script created endless temporary log files overnight, but configuring automated log rotation and lifecycle deletion policies cut storage overhead by seventy percent.
- The Holiday Season Schema Drift: A department store chain saw its automated pricing models fail during Christmas week because a vendor changed product category names without warning, but deploying automated contract testing caught the schema mismatch instantly.
- The Slow Query Bottleneck: A busy supermarket chain watched its real-time inventory dashboards freeze during peak evening shopping hours due to unindexed database queries, but applying automated query optimization rules restored sub-second dashboard loading speeds.
- The Stale Model Disaster: A fashion brand continued restocking winter coats through a warm spring because its automated retraining pipeline crashed silently, but adding explicit model health checks and automated fallback triggers kept forecasts accurate year-round.
- The Multi-Region Sync Latency: An international retailer faced conflicting inventory counts between European and Asian warehouses because data sync jobs suffered from high network latency, but shifting to event-driven message queues resolved synchronization delays completely.
- The Permission Revocation Outage: A retail analytics platform suddenly stopped receiving daily sales feeds because an automated security audit revoked service account tokens, but establishing clear credential rotation runbooks prevented future administrative lockouts.
Traditional Retail Data Management vs. Modern DataOps Approach
| Feature Area | Traditional Retail Data Management | Modern DataOps Retail Approach |
| Pipeline Testing | Manual spot-checks after failures occur | Automated continuous testing on every data push |
| Deployment Speed | Slow, monolithic releases taking months | Rapid, automated continuous delivery cycles |
| Error Handling | Reactive firefighting during emergencies | Proactive automated alerts and self-healing scripts |
| Data Quality | Frequent silent corruption and missing rows | Rigorous schema validation and data contracts |
| Team Collaboration | Siloed departments working independently | Cross-functional squads sharing unified goals |
| Model Monitoring | Ignored until business stakeholders complain | Continuous automated tracking of data drift |
| Version Control | Code tracked in Git, data left unversioned | Comprehensive versioning for code and data |
Common Mistakes and Pitfalls
- Ignoring Data Quality Checks: Teams often skip writing automated data tests because they rush to launch new predictive models, which leads to silent pipeline failures; fix this by treating data tests with the same priority as application code tests.
- Building Siloed Data Teams: Data scientists often work in complete isolation from store managers and software engineers, creating models that fail in real-world retail environments; fix this by establishing cross-functional squads that collaborate daily.
- Neglecting Model Drift Monitoring: Organizations deploy predictive models once and assume they will run accurately forever without ongoing supervision, which causes severe forecasting errors; fix this by scheduling weekly performance audits and automated drift alerts.
- Hardcoding Configuration Values: Hardcoding database credentials and file paths directly into forecasting scripts causes constant deployment failures across environments; fix this by using external environment variables and secure configuration management tools.
- Ignoring Scalability Limits: Retailers often build data pipelines that work fine on small test samples but crash completely under peak holiday data volumes; fix this by running rigorous load tests before pushing pipelines into production.
- Failing to Document Pipelines: Engineers frequently leave data pipelines undocumented, making it impossible for other team members to troubleshoot failures during late-night emergencies; fix this by maintaining clear, up-to-date pipeline architecture diagrams and runbooks.
- Overcomplicating Machine Learning Models: Teams sometimes build overly complex neural networks when simpler linear regression models would deliver faster and more reliable results; fix this by starting with simple baselines before adding advanced complexity.
- Skipping Version Control for Data: Many organizations track code changes in Git but leave raw data sets and model weights completely unversioned; fix this by adopting specialized data version control tools for every machine learning project.
- Treating Data as an Afterthought: Retail leadership sometimes views data infrastructure as a cost center rather than a core revenue driver, leading to underfunded engineering teams; fix this by tying data reliability metrics directly to company profit goals.
- Ignoring End-User Feedback: Developers often build predictive dashboards without asking store workers what information they actually need on the sales floor; fix this by conducting regular user feedback sessions with frontline retail employees.
Step-by-Step Implementation Roadmap
- Step 1: Audit Existing Retail Data Sources: Map out every data source across your physical stores, online websites, and third-party vendor feeds to understand where your information lives today.
- Step 2: Establish Version Control for Pipelines: Store all your data ingestion scripts, transformation logic, and model configuration files in a centralized Git repository for complete change tracking.
- Step 3: Implement Automated Data Testing: Write automated tests to verify schema structures, check for missing values, and flag abnormal transaction spikes before data enters your models.
- Step 4: Build a Centralized Feature Store: Organize your clean customer metrics and inventory data into a single repository so all data scientists use consistent, reusable inputs.
- Step 5: Set Up Continuous Integration Workflows: Configure automated build and test pipelines that run your code checks every single time a developer pushes a new change.
- Step 6: Deploy Automated Monitoring and Alerts: Install monitoring tools that track pipeline execution times, database resource usage, and sudden drops in daily transaction volumes.
- Step 7: Establish Model Drift Detection Rules: Create automated scripts that compare your weekly sales predictions against actual store receipts to catch model accuracy drops early.
- Step 8: Train Store Managers on Tool Usage: Conduct practical training sessions to help store managers understand your predictive dashboards and apply insights to daily inventory orders.
- Step 9: Review Performance Metrics Regularly: Track key business metrics like reduced stockouts, lower inventory holding costs, and engineering time saved to prove ongoing project value.
- Step 10: Iterate and Optimize Pipelines Continuously: Gather feedback from both engineering and retail store teams to refine your data workflows and scale predictive analytics across new store locations.
Final Recommendation and Next Steps
Start your retail data transformation by auditing your most critical inventory data pipeline today. Identify where manual steps slow down your team and introduce hidden errors. Implement automated testing for that single pipeline before expanding to other store systems. Get your data engineers and store managers talking in weekly sync meetings. Measure your pipeline uptime and stockout reductions every single month. Small, consistent improvements will build a resilient data operation that drives long-term retail success.
Frequently Asked Questions
1. What is predictive analytics in retail?
Predictive analytics in retail uses historical sales data and machine learning models to forecast future customer buying behavior and inventory demand.
2. Why do retail data pipelines fail so often?
Retail data pipelines fail due to unexpected vendor schema changes, high transaction volumes during holidays, lack of automated testing, and unmonitored database connections.
3. How does DataOps improve retail forecasting?
DataOps applies software engineering automation, continuous testing, and cross-functional collaboration to ensure retail data pipelines deliver reliable, high-quality inputs for predictive models.
4. What is data drift in retail predictive models?
Data drift happens when consumer shopping habits shift over time, causing older machine learning models to make inaccurate predictions and faulty inventory forecasts.
5. How can store managers use predictive analytics?
Store managers can use simple dashboard insights to order exact product quantities, reducing empty shelves and avoiding costly excess inventory in storage rooms.
6. What is a feature store in retail data architecture?
A feature store is a centralized repository that stores clean, reusable customer and product metrics so all data science teams use consistent data inputs.
7. How often should retail predictive models be retrained?
Retail predictive models should be retrained regularly based on automated drift detection metrics, seasonal shifts, and new transaction trends captured in your pipelines.
8. What are the key benefits of automated data testing?
Automated data testing catches broken database schemas, missing product IDs, and corrupt transaction records instantly before they ruin business reports and store forecasts.
9. How do you measure the ROI of retail DataOps?
You measure ROI by tracking reductions in pipeline debugging time, lower stockout rates, decreased inventory holding costs, and higher sales conversion rates across stores.
10. Where should a retail team start with DataOps?
A retail team should start by auditing their existing data sources, establishing version control for ingestion scripts, and implementing automated testing on their primary sales pipeline.
