Introduction
Your factory server just crashed. Again. Production stopped. Orders are backing up. And somewhere in a spreadsheet, someone is manually typing data that should have been automated months ago.
You are not alone. Most manufacturers still run on fragmented systems, tribal knowledge, and hope. But some companies cracked the code. They built clean data pipelines that turn raw machine signals into real decisions.
The platform behind many of these wins is TheDataOps.org. It helps teams move from chaos to control without rebuilding everything at once.
This guide shares real stories from factories that fixed their data problems. You will see what worked, what failed, and how to copy their success.
What Manufacturing DataOps Actually Means
DataOps sounds fancy. But strip away the buzzwords, and it is simple. DataOps is how you collect, clean, and share data so people can use it.
In manufacturing, this means pulling signals from machines, sensors, and systems. Then you make that data trustworthy. Finally, you get it to the right person at the right time.
Without DataOps, your data lives in silos. The quality team has one spreadsheet. Maintenance has another. Nobody agrees on what “downtime” actually means. As one plant manager said, if two reports disagree, stop building reports.
DataOps fixes this by creating one path from sensor to decision. It is not about buying a tool. It is about building discipline.
Why Data Pipelines Fail in Factories (The Real Reasons)
Most manufacturing data projects die before they deliver value. The reasons are predictable and avoidable.
First, legacy systems were never built to talk to each other. Your SCADA system speaks Modbus. Your ERP speaks something else. Connecting them takes custom code that breaks every time something changes.
Second, teams skip the boring foundation work. They jump straight to AI and predictive models. But dirty data destroys value. As one industry expert put it, algorithms don’t fail first—data does.
Third, nobody owns the data after the consultant leaves. Is it IT? Operations? Someone has to wake up with it daily. Without clear ownership, pipelines rot.
How HP Indigo Went from 60% to 92% Manufacturing Yield
HP Indigo builds digital printing machines. Their factories were drowning in disconnected data. Over 3,500 data volumes lived across ERPs, manufacturing platforms, and manual spreadsheets.
Tracing one consumable took two to three days. Production sometimes paused while teams searched for answers.
They moved to a unified data platform with built-in data lineage. This shows exactly where data comes from and where it goes. Suddenly, traceability dropped from days to one hour.
Then they built prediction models for manufacturing yield. Those models pushed yield from 60% to 92%. That is not a small win. That is millions in recovered production.
The Toyota Server Crash That Stopped 12 Factories
In August 2023, Toyota’s production order system crashed. Twelve of fourteen Japanese assembly plants stopped. The cause was stunningly simple.
During routine database maintenance, the system ran out of disk space. The primary server and backup ran on the same system. Both failed at once.
Production losses hit roughly 13,000 vehicles per day. All because of a storage calculation error.
This story shows why DataOps matters beyond analytics. Your data infrastructure needs monitoring, alerts, and redundancy. One overlooked parameter can stop your entire operation.
Real-World Manufacturing DataOps Success Stories
Here are ten detailed stories from factories that got it right.
- HP Indigo unified 3,500+ data volumes across disconnected systems. Their consumable traceability time dropped from 3 days to 60 minutes. Yield climbed from 60% to 92% using prediction models built on clean data.
- FAW-Volkswagen built an end-to-end data pipeline across multiple plants. They started with equipment connectivity, then standardized processing, then added dashboards. The result was faster transparency and a reusable blueprint for smart manufacturing.
- Danone operates 100+ production sites. Their legacy systems trapped data in point-to-point connections. They built a real-time event mesh called Cortex. Now factories share data instantly, enabling AI-driven maintenance and faster decisions across the enterprise.
- Thai Bridgestone had 300 machines generating data. Teams spent hours each shift manually consolidating files. After automating ingestion every 8 hours, staff focused on higher-value work. Data correction hit 100%.
- Vivix Vidros Planos extended the life of a $120 million glass furnace by two years. They combined statistical process control with predictive maintenance models. Real-time insights went directly to operators. They now run 10 production AI agents, scaling to 50.
- A manufacturing operator (via InTechHouse) had data scattered across SCADA, quality databases, and spreadsheets. Edge gateways normalized protocols to OPC UA. Validation rules caught bad data before it reached the historian. OEE visibility became real-time without manual compilation.
- A food manufacturer piloted DataOps on one production line. The first deployment took weeks to define the data model. By the third deployment, it took days. The asset hierarchy standard transferred across plants.
- A mid-sized plant discovered five different data models for one machine. They spent months just agreeing on what “downtime” meant. This reconciliation work felt slow, but it prevented years of confusion.
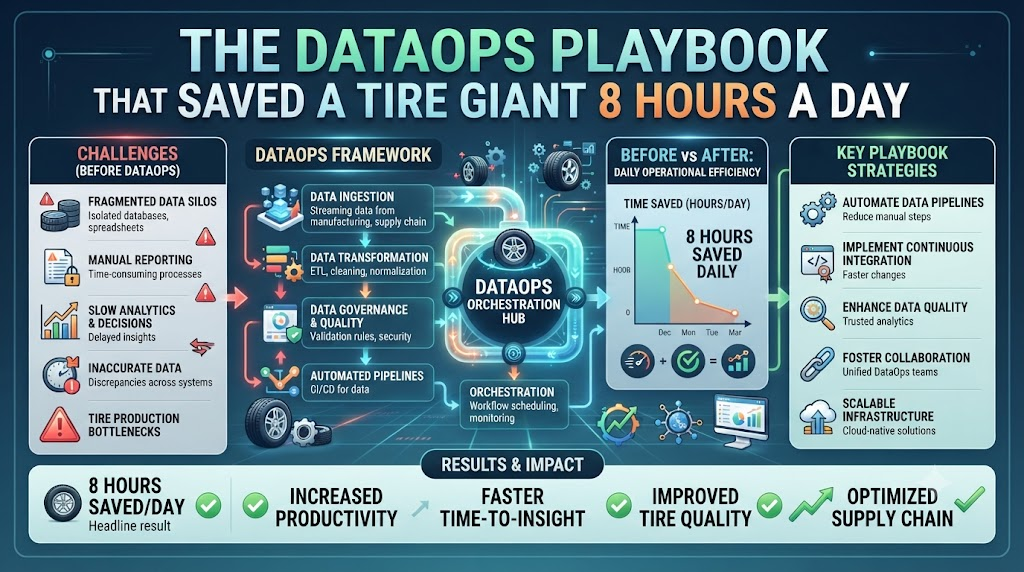
- A tire manufacturer automated data cycles every 8 hours. Manual monitoring disappeared. Built-in alerting caught data reliability issues before they affected production.
- An industrial operator inherited tribal knowledge instead of documentation. When key staff left, production knowledge walked out. DataOps forced them to write down what they actually knew.
DataOps Platforms Compared: Key Features That Matter
| Feature | Why It Matters | What to Look For |
|---|---|---|
| Data Lineage | Shows where data came from and where it goes | End-to-end visibility across systems |
| Edge Processing | Catches bad data before it spreads | Validation rules at ingestion point |
| Contextualization | Adds meaning to raw signals | Auto-attaches order, shift, operator |
| Scale-Out Templates | Makes second site deployment fast | Reusable models and configurations |
| Monitoring & Alerts | Catches problems before production stops | Real-time dashboards with thresholds |
| Governance | Clear ownership and access control | Named owners, audit logs, RBAC |
Common Mistakes and Pitfalls
Here are ten mistakes that kill manufacturing DataOps projects, plus how to fix them.
- Chasing AI before fixing data. Teams want predictive models but skip data cleanup. Fix this by spending the first month only on data quality. Prove you can trust one signal before building anything smart.
- Starting too broad. Piloting across five plants at once creates chaos. Start with one production line, one use case, one shift. Narrow scope means faster learning and lower risk.
- No named data owner. After the consultant leaves, nobody owns the pipelines. Assign a permanent owner in week one. This person wakes up with the data every day.
- Ignoring change fatigue. Operators resist cleanup because it feels like extra work. Show them the personal win—less manual reporting, fewer fire drills. Celebrate small victories loudly.
- Building custom integrations for every plant. Each new site needs a new pipeline. This does not scale. Build reusable templates. The second deployment should take days, not weeks.
- Skipping security review until the end. This is the most common cause of pilot overruns. Run security in parallel from day one. Cover network segmentation, authentication, and certificate management.
- No rollback plan. If the pilot fails, can you restore operations quickly? Define rollback criteria in week one. This makes stakeholders comfortable taking calculated risks.
- Measuring the wrong things. Model accuracy means nothing if operators ignore outputs. Measure adoption, trust, and time saved. Ask users if they would fight to keep the system.
- Forgetting about shift changes. Data pipelines must handle handoffs. Test through at least one shift change before declaring success. Edge cases live in the gaps between teams.
- Treating DataOps as a project, not a function. Pipelines degrade as equipment changes. Build continuous monitoring and iteration into the operating model. Data observability is ongoing, not a launch deliverable.
Step-by-Step Implementation Roadmap
Follow these ten steps to launch your own DataOps pilot.
- Pick one high-value use case. Predictive maintenance on your worst-downtime asset is a common starting point. Define the production KPI you want to move.
- Map your data sources and consumers. Which systems publish data? Who needs to consume it? Document every signal and every user before writing any code.
- Define your data model and topic structure. Use a consistent hierarchy like plant/line/machine/sensor. This becomes your standard for every future deployment.
- Deploy edge gateways for protocol normalization. Convert legacy Modbus and EtherNet/IP to OPC UA or MQTT. This is often the critical-path item.
- Set validation rules at ingestion. Define valid ranges and schemas for each data point. Catch bad data before it enters your pipeline.
- Build monitoring and alerting. Create a simple dashboard showing which data streams are active. Missing data should trigger alerts immediately.
- Run the pilot for one full production cycle. Include at least one shift change and one planned stoppage. Measure against numeric acceptance criteria agreed in advance.
- Assemble your evidence pack. Document what passed, what failed, and what you learned. This becomes your scale-out template.
- Decide: pass, conditional pass, or fail. Pass means scale to a second site. Conditional means fix specific issues and re-test. Fail is valuable learning—it is cheaper now than at site fifteen.
- Scale with governance already in place. The second site tests your template. If it takes materially longer than days, fix the template before adding more sites.
1. What is Manufacturing DataOps in simple terms?
Manufacturing DataOps is how you collect, clean, and share factory data so people can trust it. It connects machines, sensors, and systems. Then it delivers the right data to the right person at the right time.
2. How long does a DataOps pilot take?
A focused pilot can run in 30 days. Week one covers scoping and security. Weeks two and three build the pipeline. Week four measures results against agreed criteria.
3. What is the biggest mistake in DataOps projects?
Starting with AI before fixing data quality. Dirty data destroys value. Algorithms do not fail first—data does. Spend the first month proving you can trust one signal.
4. How do you measure DataOps success?
Use numeric acceptance criteria. Coverage: every signal mapped. Quality: latency and completeness thresholds. Resilience: survives uplink disconnection. Reuse: second site deploys in days, not weeks.
5. What role does edge computing play in manufacturing DataOps?
Edge gateways normalize legacy protocols and validate data before it leaves the plant. This catches bad data at the source. It reduces exceptions that would otherwise propagate to the historian.
6. How do you handle IT and OT convergence?
Build a bridge, not a takeover. IT brings governance and cloud skills. OT brings machine knowledge and safety requirements. The data model must respect both worlds.
7. What is a Unified Namespace and why does it matter?
A Unified Namespace is a single source of truth for all factory data. It uses a consistent topic structure based on ISA-95. This makes data findable and shareable across systems.
8. How do you scale DataOps across multiple plants?
Build reusable templates. The first deployment defines the model. The second tests the template. If the second site takes weeks instead of days, fix the template before adding more sites.
9. What causes manufacturing data pipelines to crash?
Common causes include disk space exhaustion, timestamp mismatches, service failures, and network disconnections. Toyota’s 2023 crash was caused by running out of disk space during maintenance.
10. How do you get operators to trust DataOps outputs?
Show, do not tell. Deliver one dashboard that replaces manual work. When operators see less paperwork and fewer fire drills, trust builds. Start with their pain, not your technology
Final Recommendation and Next Steps
Do not wait for perfect data. Start with one line, one shift, one problem. Prove you can deliver trustworthy data to one user. Then expand.
The companies winning with DataOps are not the ones with the fanciest AI. They are the ones who respect sequencing. Clean the data. Contextualize it. Then apply the math.
Pick your worst-downtime asset this week. Map its data sources. Talk to the operator who runs it. That conversation will teach you more than any vendor demo. DataOps is a journey of a thousand small fixes. Start walking today.
